French vs Northern European Child Poverty Among Girls Under 16
COMPARE
French
Northern European
Child Poverty Among Girls Under 16
Child Poverty Among Girls Under 16 Comparison
French
Northern Europeans
16.0%
CHILD POVERTY AMONG GIRLS UNDER 16
72.8/ 100
METRIC RATING
160th/ 347
METRIC RANK
14.8%
CHILD POVERTY AMONG GIRLS UNDER 16
97.0/ 100
METRIC RATING
90th/ 347
METRIC RANK
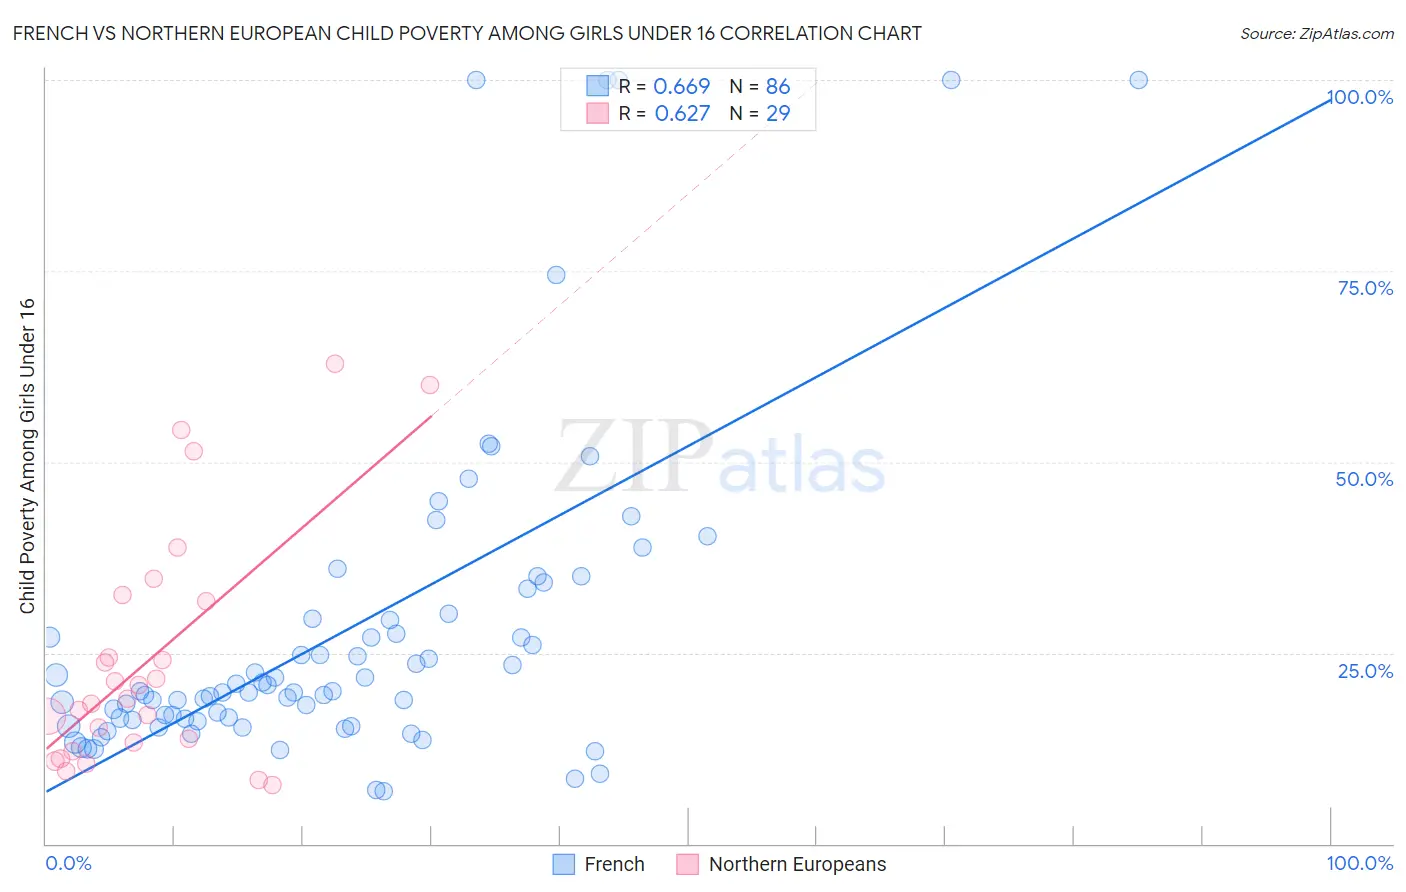
French vs Northern European Child Poverty Among Girls Under 16 Correlation Chart
The statistical analysis conducted on geographies consisting of 549,650,331 people shows a significant positive correlation between the proportion of French and poverty level among girls under the age of 16 in the United States with a correlation coefficient (R) of 0.669 and weighted average of 16.0%. Similarly, the statistical analysis conducted on geographies consisting of 396,909,088 people shows a significant positive correlation between the proportion of Northern Europeans and poverty level among girls under the age of 16 in the United States with a correlation coefficient (R) of 0.627 and weighted average of 14.8%, a difference of 8.0%.
Child Poverty Among Girls Under 16 Correlation Summary
| Measurement | French | Northern European |
| Minimum | 6.8% | 7.8% |
| Maximum | 100.0% | 62.9% |
| Range | 93.2% | 55.1% |
| Mean | 27.8% | 24.2% |
| Median | 19.9% | 19.0% |
| Interquartile 25% (IQ1) | 16.2% | 12.7% |
| Interquartile 75% (IQ3) | 29.5% | 32.2% |
| Interquartile Range (IQR) | 13.3% | 19.5% |
| Standard Deviation (Sample) | 21.4% | 15.6% |
| Standard Deviation (Population) | 21.3% | 15.4% |
Similar Demographics by Child Poverty Among Girls Under 16
Demographics Similar to French by Child Poverty Among Girls Under 16
In terms of child poverty among girls under 16, the demographic groups most similar to French are Immigrants from Northern Africa (16.0%, a difference of 0.11%), Slovak (15.9%, a difference of 0.38%), Guamanian/Chamorro (15.9%, a difference of 0.40%), Immigrants from Fiji (15.9%, a difference of 0.52%), and Colombian (15.9%, a difference of 0.52%).
| Demographics | Rating | Rank | Child Poverty Among Girls Under 16 |
| Immigrants | Nepal | 78.5 /100 | #153 | Good 15.9% |
| Immigrants | Chile | 76.7 /100 | #154 | Good 15.9% |
| Syrians | 76.7 /100 | #155 | Good 15.9% |
| Immigrants | Fiji | 76.1 /100 | #156 | Good 15.9% |
| Colombians | 76.1 /100 | #157 | Good 15.9% |
| Guamanians/Chamorros | 75.3 /100 | #158 | Good 15.9% |
| Slovaks | 75.2 /100 | #159 | Good 15.9% |
| French | 72.8 /100 | #160 | Good 16.0% |
| Immigrants | Northern Africa | 72.0 /100 | #161 | Good 16.0% |
| French Canadians | 68.7 /100 | #162 | Good 16.1% |
| Immigrants | Oceania | 68.4 /100 | #163 | Good 16.1% |
| Immigrants | Colombia | 67.8 /100 | #164 | Good 16.1% |
| Immigrants | Germany | 67.3 /100 | #165 | Good 16.1% |
| South Americans | 67.2 /100 | #166 | Good 16.1% |
| Uruguayans | 64.7 /100 | #167 | Good 16.2% |
Demographics Similar to Northern Europeans by Child Poverty Among Girls Under 16
In terms of child poverty among girls under 16, the demographic groups most similar to Northern Europeans are Jordanian (14.8%, a difference of 0.020%), Immigrants from Belarus (14.8%, a difference of 0.040%), Immigrants from Canada (14.8%, a difference of 0.070%), Finnish (14.8%, a difference of 0.14%), and Australian (14.8%, a difference of 0.16%).
| Demographics | Rating | Rank | Child Poverty Among Girls Under 16 |
| Immigrants | Italy | 97.4 /100 | #83 | Exceptional 14.8% |
| Soviet Union | 97.3 /100 | #84 | Exceptional 14.8% |
| Swiss | 97.2 /100 | #85 | Exceptional 14.8% |
| Australians | 97.2 /100 | #86 | Exceptional 14.8% |
| Finns | 97.2 /100 | #87 | Exceptional 14.8% |
| Immigrants | Canada | 97.1 /100 | #88 | Exceptional 14.8% |
| Jordanians | 97.1 /100 | #89 | Exceptional 14.8% |
| Northern Europeans | 97.0 /100 | #90 | Exceptional 14.8% |
| Immigrants | Belarus | 97.0 /100 | #91 | Exceptional 14.8% |
| Austrians | 96.7 /100 | #92 | Exceptional 14.9% |
| Immigrants | North America | 96.6 /100 | #93 | Exceptional 14.9% |
| Immigrants | Switzerland | 96.3 /100 | #94 | Exceptional 14.9% |
| Germans | 96.3 /100 | #95 | Exceptional 14.9% |
| Immigrants | France | 96.2 /100 | #96 | Exceptional 14.9% |
| Immigrants | Latvia | 96.1 /100 | #97 | Exceptional 14.9% |