Filipino vs Guamanian/Chamorro Ambulatory Disability
COMPARE
Filipino
Guamanian/Chamorro
Ambulatory Disability
Ambulatory Disability Comparison
Filipinos
Guamanians/Chamorros
4.9%
AMBULATORY DISABILITY
100.0/ 100
METRIC RATING
2nd/ 347
METRIC RANK
6.3%
AMBULATORY DISABILITY
10.6/ 100
METRIC RATING
218th/ 347
METRIC RANK
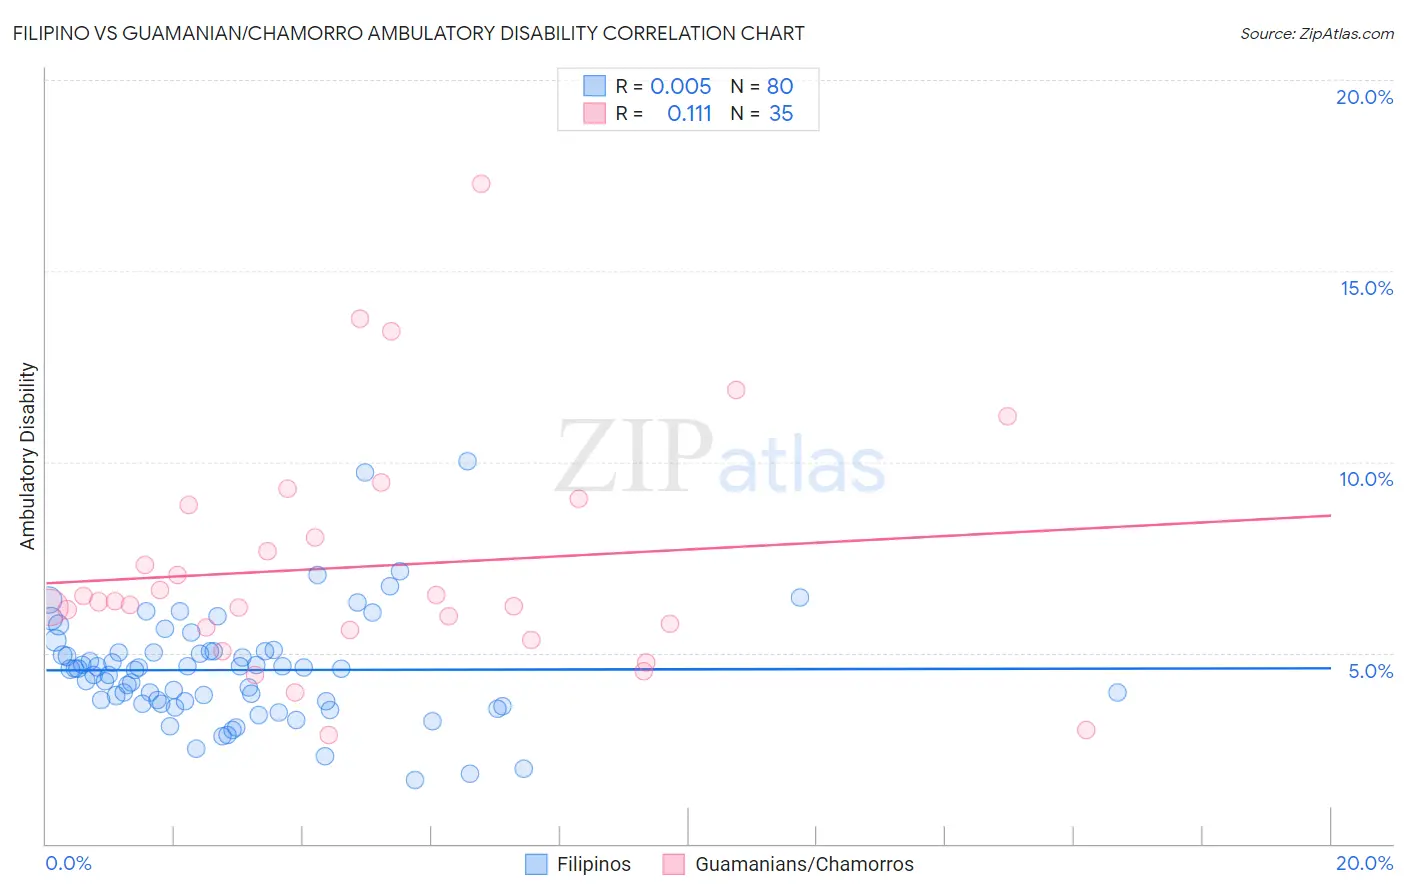
Filipino vs Guamanian/Chamorro Ambulatory Disability Correlation Chart
The statistical analysis conducted on geographies consisting of 254,292,295 people shows no correlation between the proportion of Filipinos and percentage of population with ambulatory disability in the United States with a correlation coefficient (R) of 0.005 and weighted average of 4.9%. Similarly, the statistical analysis conducted on geographies consisting of 221,865,083 people shows a poor positive correlation between the proportion of Guamanians/Chamorros and percentage of population with ambulatory disability in the United States with a correlation coefficient (R) of 0.111 and weighted average of 6.3%, a difference of 29.3%.
Ambulatory Disability Correlation Summary
| Measurement | Filipino | Guamanian/Chamorro |
| Minimum | 1.7% | 2.8% |
| Maximum | 10.0% | 17.3% |
| Range | 8.3% | 14.4% |
| Mean | 4.5% | 7.3% |
| Median | 4.6% | 6.3% |
| Interquartile 25% (IQ1) | 3.7% | 5.6% |
| Interquartile 75% (IQ3) | 5.0% | 8.9% |
| Interquartile Range (IQR) | 1.3% | 3.3% |
| Standard Deviation (Sample) | 1.4% | 3.1% |
| Standard Deviation (Population) | 1.4% | 3.1% |
Similar Demographics by Ambulatory Disability
Demographics Similar to Filipinos by Ambulatory Disability
In terms of ambulatory disability, the demographic groups most similar to Filipinos are Thai (4.9%, a difference of 1.2%), Immigrants from Taiwan (4.9%, a difference of 1.4%), Immigrants from India (4.8%, a difference of 2.0%), Immigrants from Singapore (5.0%, a difference of 2.8%), and Immigrants from Bolivia (5.0%, a difference of 3.5%).
| Demographics | Rating | Rank | Ambulatory Disability |
| Immigrants | India | 100.0 /100 | #1 | Exceptional 4.8% |
| Filipinos | 100.0 /100 | #2 | Exceptional 4.9% |
| Thais | 100.0 /100 | #3 | Exceptional 4.9% |
| Immigrants | Taiwan | 100.0 /100 | #4 | Exceptional 4.9% |
| Immigrants | Singapore | 100.0 /100 | #5 | Exceptional 5.0% |
| Immigrants | Bolivia | 100.0 /100 | #6 | Exceptional 5.0% |
| Bolivians | 100.0 /100 | #7 | Exceptional 5.1% |
| Immigrants | South Central Asia | 100.0 /100 | #8 | Exceptional 5.1% |
| Iranians | 100.0 /100 | #9 | Exceptional 5.1% |
| Yup'ik | 100.0 /100 | #10 | Exceptional 5.2% |
| Immigrants | Korea | 100.0 /100 | #11 | Exceptional 5.2% |
| Okinawans | 100.0 /100 | #12 | Exceptional 5.3% |
| Burmese | 100.0 /100 | #13 | Exceptional 5.3% |
| Immigrants | Eastern Asia | 100.0 /100 | #14 | Exceptional 5.3% |
| Immigrants | China | 100.0 /100 | #15 | Exceptional 5.3% |
Demographics Similar to Guamanians/Chamorros by Ambulatory Disability
In terms of ambulatory disability, the demographic groups most similar to Guamanians/Chamorros are Canadian (6.3%, a difference of 0.040%), Yugoslavian (6.3%, a difference of 0.040%), Immigrants from Latin America (6.3%, a difference of 0.050%), Immigrants from Mexico (6.3%, a difference of 0.060%), and Indonesian (6.3%, a difference of 0.10%).
| Demographics | Rating | Rank | Ambulatory Disability |
| Samoans | 12.1 /100 | #211 | Poor 6.3% |
| Mexican American Indians | 12.0 /100 | #212 | Poor 6.3% |
| Japanese | 12.0 /100 | #213 | Poor 6.3% |
| Immigrants | Mexico | 11.0 /100 | #214 | Poor 6.3% |
| Immigrants | Latin America | 11.0 /100 | #215 | Poor 6.3% |
| Canadians | 10.9 /100 | #216 | Poor 6.3% |
| Yugoslavians | 10.9 /100 | #217 | Poor 6.3% |
| Guamanians/Chamorros | 10.6 /100 | #218 | Poor 6.3% |
| Indonesians | 9.9 /100 | #219 | Tragic 6.3% |
| Immigrants | Albania | 9.6 /100 | #220 | Tragic 6.3% |
| Hungarians | 9.6 /100 | #221 | Tragic 6.3% |
| German Russians | 9.4 /100 | #222 | Tragic 6.3% |
| Immigrants | Honduras | 7.6 /100 | #223 | Tragic 6.3% |
| Liberians | 7.1 /100 | #224 | Tragic 6.3% |
| Hondurans | 6.3 /100 | #225 | Tragic 6.3% |