Filipino vs Guamanian/Chamorro Disability Age 35 to 64
COMPARE
Filipino
Guamanian/Chamorro
Disability Age 35 to 64
Disability Age 35 to 64 Comparison
Filipinos
Guamanians/Chamorros
8.0%
DISABILITY AGE 35 TO 64
100.0/ 100
METRIC RATING
2nd/ 347
METRIC RANK
12.2%
DISABILITY AGE 35 TO 64
1.4/ 100
METRIC RATING
246th/ 347
METRIC RANK
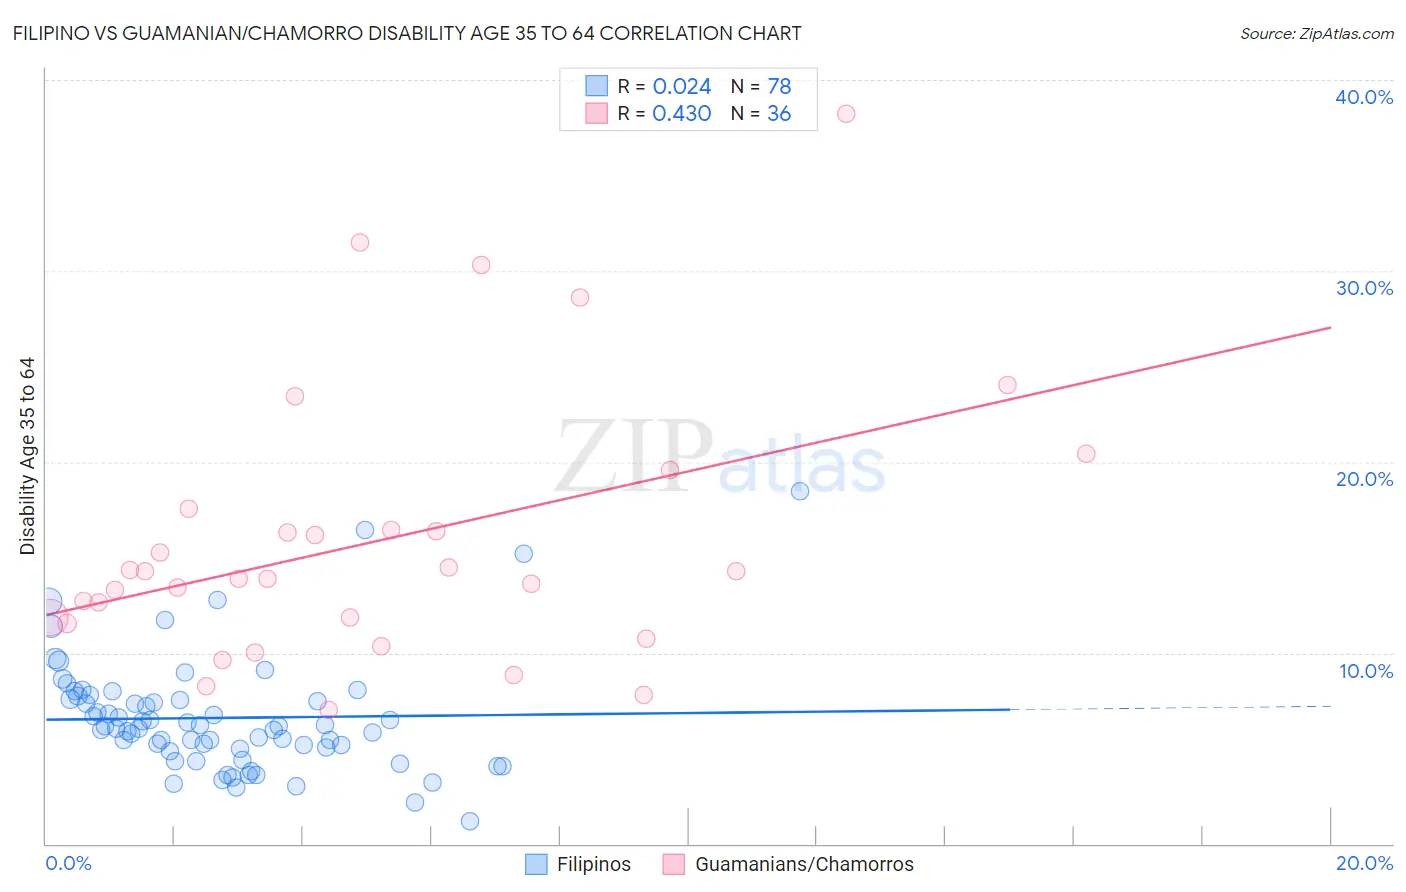
Filipino vs Guamanian/Chamorro Disability Age 35 to 64 Correlation Chart
The statistical analysis conducted on geographies consisting of 254,159,243 people shows no correlation between the proportion of Filipinos and percentage of population with a disability between the ages 34 and 64 in the United States with a correlation coefficient (R) of 0.024 and weighted average of 8.0%. Similarly, the statistical analysis conducted on geographies consisting of 221,858,951 people shows a moderate positive correlation between the proportion of Guamanians/Chamorros and percentage of population with a disability between the ages 34 and 64 in the United States with a correlation coefficient (R) of 0.430 and weighted average of 12.2%, a difference of 52.0%.
Disability Age 35 to 64 Correlation Summary
| Measurement | Filipino | Guamanian/Chamorro |
| Minimum | 1.2% | 7.0% |
| Maximum | 18.4% | 38.2% |
| Range | 17.2% | 31.2% |
| Mean | 6.6% | 15.9% |
| Median | 6.1% | 14.1% |
| Interquartile 25% (IQ1) | 5.0% | 11.7% |
| Interquartile 75% (IQ3) | 7.6% | 17.0% |
| Interquartile Range (IQR) | 2.6% | 5.3% |
| Standard Deviation (Sample) | 3.0% | 7.1% |
| Standard Deviation (Population) | 3.0% | 7.0% |
Similar Demographics by Disability Age 35 to 64
Demographics Similar to Filipinos by Disability Age 35 to 64
In terms of disability age 35 to 64, the demographic groups most similar to Filipinos are Immigrants from Hong Kong (8.2%, a difference of 1.8%), Immigrants from Taiwan (7.8%, a difference of 2.5%), Immigrants from India (8.3%, a difference of 2.9%), Immigrants from Iran (8.5%, a difference of 5.5%), and Thai (8.6%, a difference of 6.5%).
| Demographics | Rating | Rank | Disability Age 35 to 64 |
| Immigrants | Taiwan | 100.0 /100 | #1 | Exceptional 7.8% |
| Filipinos | 100.0 /100 | #2 | Exceptional 8.0% |
| Immigrants | Hong Kong | 100.0 /100 | #3 | Exceptional 8.2% |
| Immigrants | India | 100.0 /100 | #4 | Exceptional 8.3% |
| Immigrants | Iran | 100.0 /100 | #5 | Exceptional 8.5% |
| Thais | 100.0 /100 | #6 | Exceptional 8.6% |
| Immigrants | Israel | 100.0 /100 | #7 | Exceptional 8.6% |
| Iranians | 100.0 /100 | #8 | Exceptional 8.7% |
| Immigrants | China | 100.0 /100 | #9 | Exceptional 8.7% |
| Immigrants | Bolivia | 100.0 /100 | #10 | Exceptional 8.7% |
| Immigrants | Eastern Asia | 100.0 /100 | #11 | Exceptional 8.8% |
| Indians (Asian) | 100.0 /100 | #12 | Exceptional 8.9% |
| Immigrants | South Central Asia | 100.0 /100 | #13 | Exceptional 8.9% |
| Immigrants | Singapore | 100.0 /100 | #14 | Exceptional 8.9% |
| Bolivians | 100.0 /100 | #15 | Exceptional 8.9% |
Demographics Similar to Guamanians/Chamorros by Disability Age 35 to 64
In terms of disability age 35 to 64, the demographic groups most similar to Guamanians/Chamorros are Immigrants from Senegal (12.2%, a difference of 0.040%), Spaniard (12.3%, a difference of 0.13%), Hispanic or Latino (12.3%, a difference of 0.16%), Immigrants from Burma/Myanmar (12.3%, a difference of 0.29%), and German (12.3%, a difference of 0.37%).
| Demographics | Rating | Rank | Disability Age 35 to 64 |
| Immigrants | Western Africa | 3.3 /100 | #239 | Tragic 12.0% |
| Immigrants | Thailand | 3.3 /100 | #240 | Tragic 12.0% |
| Mexican American Indians | 3.2 /100 | #241 | Tragic 12.0% |
| Samoans | 2.8 /100 | #242 | Tragic 12.1% |
| Slovaks | 2.7 /100 | #243 | Tragic 12.1% |
| Finns | 2.3 /100 | #244 | Tragic 12.1% |
| Immigrants | Mexico | 2.2 /100 | #245 | Tragic 12.1% |
| Guamanians/Chamorros | 1.4 /100 | #246 | Tragic 12.2% |
| Immigrants | Senegal | 1.3 /100 | #247 | Tragic 12.2% |
| Spaniards | 1.3 /100 | #248 | Tragic 12.3% |
| Hispanics or Latinos | 1.3 /100 | #249 | Tragic 12.3% |
| Immigrants | Burma/Myanmar | 1.2 /100 | #250 | Tragic 12.3% |
| Germans | 1.1 /100 | #251 | Tragic 12.3% |
| Irish | 1.0 /100 | #252 | Tragic 12.3% |
| Dutch | 1.0 /100 | #253 | Tragic 12.3% |