Immigrants from Venezuela vs Guamanian/Chamorro Ambulatory Disability
COMPARE
Immigrants from Venezuela
Guamanian/Chamorro
Ambulatory Disability
Ambulatory Disability Comparison
Immigrants from Venezuela
Guamanians/Chamorros
5.4%
AMBULATORY DISABILITY
100.0/ 100
METRIC RATING
31st/ 347
METRIC RANK
6.3%
AMBULATORY DISABILITY
10.6/ 100
METRIC RATING
218th/ 347
METRIC RANK
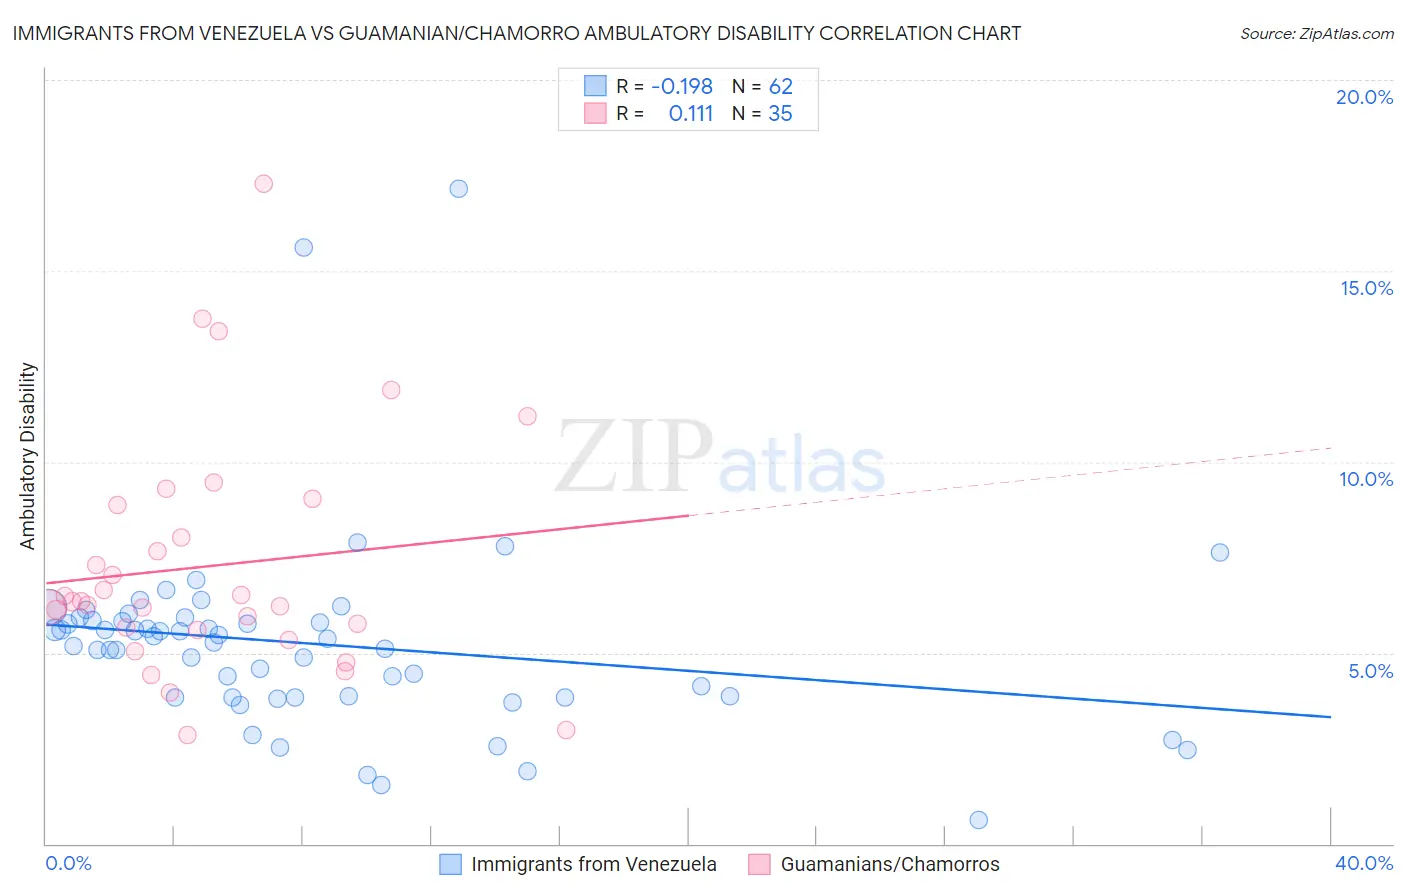
Immigrants from Venezuela vs Guamanian/Chamorro Ambulatory Disability Correlation Chart
The statistical analysis conducted on geographies consisting of 287,823,079 people shows a poor negative correlation between the proportion of Immigrants from Venezuela and percentage of population with ambulatory disability in the United States with a correlation coefficient (R) of -0.198 and weighted average of 5.4%. Similarly, the statistical analysis conducted on geographies consisting of 221,865,083 people shows a poor positive correlation between the proportion of Guamanians/Chamorros and percentage of population with ambulatory disability in the United States with a correlation coefficient (R) of 0.111 and weighted average of 6.3%, a difference of 15.5%.
Ambulatory Disability Correlation Summary
| Measurement | Immigrants from Venezuela | Guamanian/Chamorro |
| Minimum | 0.63% | 2.8% |
| Maximum | 17.1% | 17.3% |
| Range | 16.5% | 14.4% |
| Mean | 5.2% | 7.3% |
| Median | 5.3% | 6.3% |
| Interquartile 25% (IQ1) | 3.8% | 5.6% |
| Interquartile 75% (IQ3) | 5.8% | 8.9% |
| Interquartile Range (IQR) | 2.0% | 3.3% |
| Standard Deviation (Sample) | 2.6% | 3.1% |
| Standard Deviation (Population) | 2.5% | 3.1% |
Similar Demographics by Ambulatory Disability
Demographics Similar to Immigrants from Venezuela by Ambulatory Disability
In terms of ambulatory disability, the demographic groups most similar to Immigrants from Venezuela are Immigrants from Turkey (5.4%, a difference of 0.020%), Immigrants from Australia (5.5%, a difference of 0.17%), Immigrants from Pakistan (5.5%, a difference of 0.29%), Immigrants from Asia (5.5%, a difference of 0.44%), and Afghan (5.5%, a difference of 0.49%).
| Demographics | Rating | Rank | Ambulatory Disability |
| Immigrants | Saudi Arabia | 100.0 /100 | #24 | Exceptional 5.4% |
| Zimbabweans | 100.0 /100 | #25 | Exceptional 5.4% |
| Immigrants | Nepal | 100.0 /100 | #26 | Exceptional 5.4% |
| Asians | 100.0 /100 | #27 | Exceptional 5.4% |
| Cambodians | 100.0 /100 | #28 | Exceptional 5.4% |
| Immigrants | Iran | 100.0 /100 | #29 | Exceptional 5.4% |
| Immigrants | Turkey | 100.0 /100 | #30 | Exceptional 5.4% |
| Immigrants | Venezuela | 100.0 /100 | #31 | Exceptional 5.4% |
| Immigrants | Australia | 100.0 /100 | #32 | Exceptional 5.5% |
| Immigrants | Pakistan | 100.0 /100 | #33 | Exceptional 5.5% |
| Immigrants | Asia | 100.0 /100 | #34 | Exceptional 5.5% |
| Afghans | 100.0 /100 | #35 | Exceptional 5.5% |
| Immigrants | Malaysia | 100.0 /100 | #36 | Exceptional 5.5% |
| Turks | 100.0 /100 | #37 | Exceptional 5.5% |
| Cypriots | 100.0 /100 | #38 | Exceptional 5.5% |
Demographics Similar to Guamanians/Chamorros by Ambulatory Disability
In terms of ambulatory disability, the demographic groups most similar to Guamanians/Chamorros are Canadian (6.3%, a difference of 0.040%), Yugoslavian (6.3%, a difference of 0.040%), Immigrants from Latin America (6.3%, a difference of 0.050%), Immigrants from Mexico (6.3%, a difference of 0.060%), and Indonesian (6.3%, a difference of 0.10%).
| Demographics | Rating | Rank | Ambulatory Disability |
| Samoans | 12.1 /100 | #211 | Poor 6.3% |
| Mexican American Indians | 12.0 /100 | #212 | Poor 6.3% |
| Japanese | 12.0 /100 | #213 | Poor 6.3% |
| Immigrants | Mexico | 11.0 /100 | #214 | Poor 6.3% |
| Immigrants | Latin America | 11.0 /100 | #215 | Poor 6.3% |
| Canadians | 10.9 /100 | #216 | Poor 6.3% |
| Yugoslavians | 10.9 /100 | #217 | Poor 6.3% |
| Guamanians/Chamorros | 10.6 /100 | #218 | Poor 6.3% |
| Indonesians | 9.9 /100 | #219 | Tragic 6.3% |
| Immigrants | Albania | 9.6 /100 | #220 | Tragic 6.3% |
| Hungarians | 9.6 /100 | #221 | Tragic 6.3% |
| German Russians | 9.4 /100 | #222 | Tragic 6.3% |
| Immigrants | Honduras | 7.6 /100 | #223 | Tragic 6.3% |
| Liberians | 7.1 /100 | #224 | Tragic 6.3% |
| Hondurans | 6.3 /100 | #225 | Tragic 6.3% |