Filipino vs Immigrants from Belize Ambulatory Disability
COMPARE
Filipino
Immigrants from Belize
Ambulatory Disability
Ambulatory Disability Comparison
Filipinos
Immigrants from Belize
4.9%
AMBULATORY DISABILITY
100.0/ 100
METRIC RATING
2nd/ 347
METRIC RANK
6.6%
AMBULATORY DISABILITY
0.4/ 100
METRIC RATING
260th/ 347
METRIC RANK
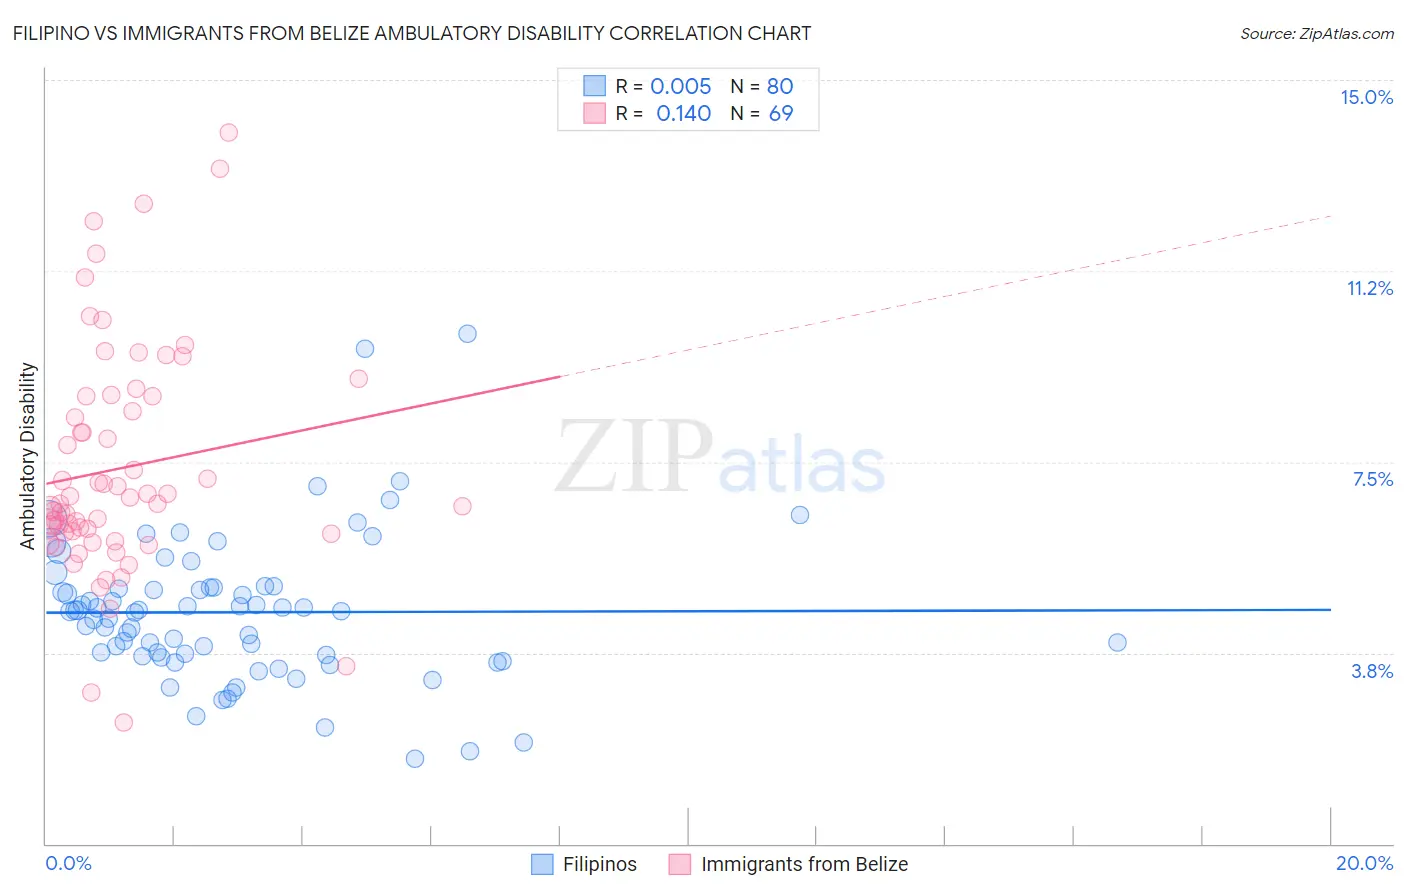
Filipino vs Immigrants from Belize Ambulatory Disability Correlation Chart
The statistical analysis conducted on geographies consisting of 254,292,295 people shows no correlation between the proportion of Filipinos and percentage of population with ambulatory disability in the United States with a correlation coefficient (R) of 0.005 and weighted average of 4.9%. Similarly, the statistical analysis conducted on geographies consisting of 130,290,767 people shows a poor positive correlation between the proportion of Immigrants from Belize and percentage of population with ambulatory disability in the United States with a correlation coefficient (R) of 0.140 and weighted average of 6.6%, a difference of 34.7%.
Ambulatory Disability Correlation Summary
| Measurement | Filipino | Immigrants from Belize |
| Minimum | 1.7% | 2.4% |
| Maximum | 10.0% | 14.0% |
| Range | 8.3% | 11.6% |
| Mean | 4.5% | 7.4% |
| Median | 4.6% | 6.7% |
| Interquartile 25% (IQ1) | 3.7% | 6.1% |
| Interquartile 75% (IQ3) | 5.0% | 8.8% |
| Interquartile Range (IQR) | 1.3% | 2.7% |
| Standard Deviation (Sample) | 1.4% | 2.3% |
| Standard Deviation (Population) | 1.4% | 2.2% |
Similar Demographics by Ambulatory Disability
Demographics Similar to Filipinos by Ambulatory Disability
In terms of ambulatory disability, the demographic groups most similar to Filipinos are Thai (4.9%, a difference of 1.2%), Immigrants from Taiwan (4.9%, a difference of 1.4%), Immigrants from India (4.8%, a difference of 2.0%), Immigrants from Singapore (5.0%, a difference of 2.8%), and Immigrants from Bolivia (5.0%, a difference of 3.5%).
| Demographics | Rating | Rank | Ambulatory Disability |
| Immigrants | India | 100.0 /100 | #1 | Exceptional 4.8% |
| Filipinos | 100.0 /100 | #2 | Exceptional 4.9% |
| Thais | 100.0 /100 | #3 | Exceptional 4.9% |
| Immigrants | Taiwan | 100.0 /100 | #4 | Exceptional 4.9% |
| Immigrants | Singapore | 100.0 /100 | #5 | Exceptional 5.0% |
| Immigrants | Bolivia | 100.0 /100 | #6 | Exceptional 5.0% |
| Bolivians | 100.0 /100 | #7 | Exceptional 5.1% |
| Immigrants | South Central Asia | 100.0 /100 | #8 | Exceptional 5.1% |
| Iranians | 100.0 /100 | #9 | Exceptional 5.1% |
| Yup'ik | 100.0 /100 | #10 | Exceptional 5.2% |
| Immigrants | Korea | 100.0 /100 | #11 | Exceptional 5.2% |
| Okinawans | 100.0 /100 | #12 | Exceptional 5.3% |
| Burmese | 100.0 /100 | #13 | Exceptional 5.3% |
| Immigrants | Eastern Asia | 100.0 /100 | #14 | Exceptional 5.3% |
| Immigrants | China | 100.0 /100 | #15 | Exceptional 5.3% |
Demographics Similar to Immigrants from Belize by Ambulatory Disability
In terms of ambulatory disability, the demographic groups most similar to Immigrants from Belize are Aleut (6.6%, a difference of 0.010%), Irish (6.6%, a difference of 0.070%), Spanish American Indian (6.5%, a difference of 0.19%), English (6.6%, a difference of 0.24%), and Bermudan (6.5%, a difference of 0.27%).
| Demographics | Rating | Rank | Ambulatory Disability |
| Scottish | 0.7 /100 | #253 | Tragic 6.5% |
| Belizeans | 0.7 /100 | #254 | Tragic 6.5% |
| Welsh | 0.6 /100 | #255 | Tragic 6.5% |
| Immigrants | Uzbekistan | 0.6 /100 | #256 | Tragic 6.5% |
| Bermudans | 0.5 /100 | #257 | Tragic 6.5% |
| Spanish American Indians | 0.5 /100 | #258 | Tragic 6.5% |
| Aleuts | 0.4 /100 | #259 | Tragic 6.6% |
| Immigrants | Belize | 0.4 /100 | #260 | Tragic 6.6% |
| Irish | 0.4 /100 | #261 | Tragic 6.6% |
| English | 0.4 /100 | #262 | Tragic 6.6% |
| Hmong | 0.3 /100 | #263 | Tragic 6.6% |
| Nepalese | 0.2 /100 | #264 | Tragic 6.6% |
| Bahamians | 0.2 /100 | #265 | Tragic 6.6% |
| Guyanese | 0.2 /100 | #266 | Tragic 6.6% |
| Trinidadians and Tobagonians | 0.2 /100 | #267 | Tragic 6.6% |