Immigrants from Yemen vs Guamanian/Chamorro Ambulatory Disability
COMPARE
Immigrants from Yemen
Guamanian/Chamorro
Ambulatory Disability
Ambulatory Disability Comparison
Immigrants from Yemen
Guamanians/Chamorros
7.1%
AMBULATORY DISABILITY
0.0/ 100
METRIC RATING
313th/ 347
METRIC RANK
6.3%
AMBULATORY DISABILITY
10.6/ 100
METRIC RATING
218th/ 347
METRIC RANK
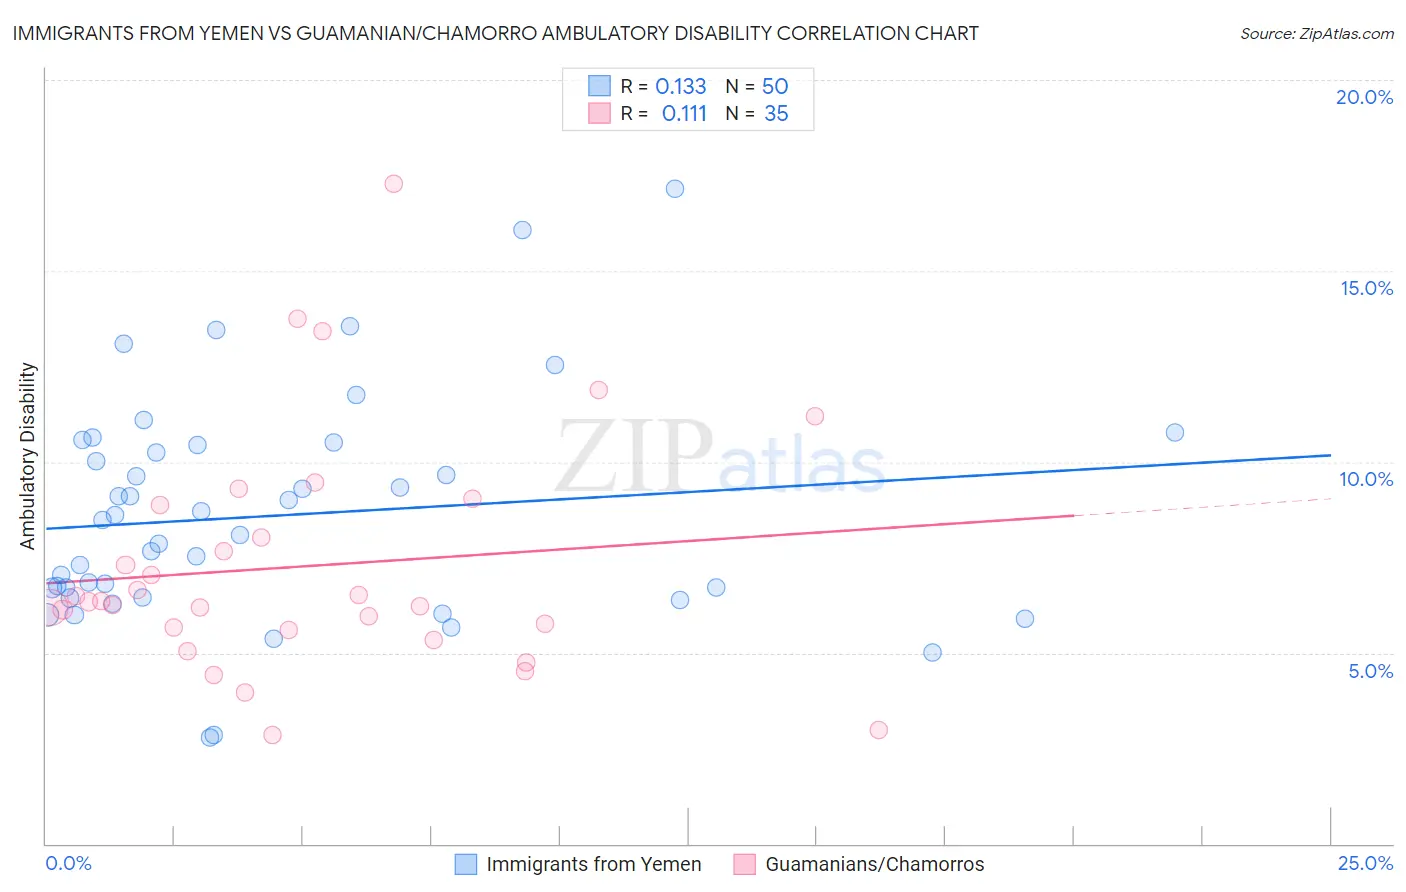
Immigrants from Yemen vs Guamanian/Chamorro Ambulatory Disability Correlation Chart
The statistical analysis conducted on geographies consisting of 82,432,015 people shows a poor positive correlation between the proportion of Immigrants from Yemen and percentage of population with ambulatory disability in the United States with a correlation coefficient (R) of 0.133 and weighted average of 7.1%. Similarly, the statistical analysis conducted on geographies consisting of 221,865,083 people shows a poor positive correlation between the proportion of Guamanians/Chamorros and percentage of population with ambulatory disability in the United States with a correlation coefficient (R) of 0.111 and weighted average of 6.3%, a difference of 13.3%.
Ambulatory Disability Correlation Summary
| Measurement | Immigrants from Yemen | Guamanian/Chamorro |
| Minimum | 2.8% | 2.8% |
| Maximum | 17.1% | 17.3% |
| Range | 14.4% | 14.4% |
| Mean | 8.6% | 7.3% |
| Median | 8.3% | 6.3% |
| Interquartile 25% (IQ1) | 6.4% | 5.6% |
| Interquartile 75% (IQ3) | 10.4% | 8.9% |
| Interquartile Range (IQR) | 4.0% | 3.3% |
| Standard Deviation (Sample) | 3.0% | 3.1% |
| Standard Deviation (Population) | 2.9% | 3.1% |
Similar Demographics by Ambulatory Disability
Demographics Similar to Immigrants from Yemen by Ambulatory Disability
In terms of ambulatory disability, the demographic groups most similar to Immigrants from Yemen are Blackfeet (7.1%, a difference of 0.020%), Shoshone (7.1%, a difference of 0.040%), Delaware (7.1%, a difference of 0.13%), Immigrants from Dominican Republic (7.1%, a difference of 0.28%), and Cree (7.1%, a difference of 0.35%).
| Demographics | Rating | Rank | Ambulatory Disability |
| Iroquois | 0.0 /100 | #306 | Tragic 7.1% |
| Spanish Americans | 0.0 /100 | #307 | Tragic 7.1% |
| Chippewa | 0.0 /100 | #308 | Tragic 7.1% |
| Immigrants | Azores | 0.0 /100 | #309 | Tragic 7.1% |
| Arapaho | 0.0 /100 | #310 | Tragic 7.1% |
| Cree | 0.0 /100 | #311 | Tragic 7.1% |
| Delaware | 0.0 /100 | #312 | Tragic 7.1% |
| Immigrants | Yemen | 0.0 /100 | #313 | Tragic 7.1% |
| Blackfeet | 0.0 /100 | #314 | Tragic 7.1% |
| Shoshone | 0.0 /100 | #315 | Tragic 7.1% |
| Immigrants | Dominican Republic | 0.0 /100 | #316 | Tragic 7.1% |
| Central American Indians | 0.0 /100 | #317 | Tragic 7.2% |
| Ottawa | 0.0 /100 | #318 | Tragic 7.2% |
| Dominicans | 0.0 /100 | #319 | Tragic 7.2% |
| Potawatomi | 0.0 /100 | #320 | Tragic 7.3% |
Demographics Similar to Guamanians/Chamorros by Ambulatory Disability
In terms of ambulatory disability, the demographic groups most similar to Guamanians/Chamorros are Canadian (6.3%, a difference of 0.040%), Yugoslavian (6.3%, a difference of 0.040%), Immigrants from Latin America (6.3%, a difference of 0.050%), Immigrants from Mexico (6.3%, a difference of 0.060%), and Indonesian (6.3%, a difference of 0.10%).
| Demographics | Rating | Rank | Ambulatory Disability |
| Samoans | 12.1 /100 | #211 | Poor 6.3% |
| Mexican American Indians | 12.0 /100 | #212 | Poor 6.3% |
| Japanese | 12.0 /100 | #213 | Poor 6.3% |
| Immigrants | Mexico | 11.0 /100 | #214 | Poor 6.3% |
| Immigrants | Latin America | 11.0 /100 | #215 | Poor 6.3% |
| Canadians | 10.9 /100 | #216 | Poor 6.3% |
| Yugoslavians | 10.9 /100 | #217 | Poor 6.3% |
| Guamanians/Chamorros | 10.6 /100 | #218 | Poor 6.3% |
| Indonesians | 9.9 /100 | #219 | Tragic 6.3% |
| Immigrants | Albania | 9.6 /100 | #220 | Tragic 6.3% |
| Hungarians | 9.6 /100 | #221 | Tragic 6.3% |
| German Russians | 9.4 /100 | #222 | Tragic 6.3% |
| Immigrants | Honduras | 7.6 /100 | #223 | Tragic 6.3% |
| Liberians | 7.1 /100 | #224 | Tragic 6.3% |
| Hondurans | 6.3 /100 | #225 | Tragic 6.3% |