Estonian vs Immigrants from Ireland Ambulatory Disability
COMPARE
Estonian
Immigrants from Ireland
Ambulatory Disability
Ambulatory Disability Comparison
Estonians
Immigrants from Ireland
5.9%
AMBULATORY DISABILITY
92.9/ 100
METRIC RATING
120th/ 347
METRIC RANK
5.7%
AMBULATORY DISABILITY
99.2/ 100
METRIC RATING
80th/ 347
METRIC RANK
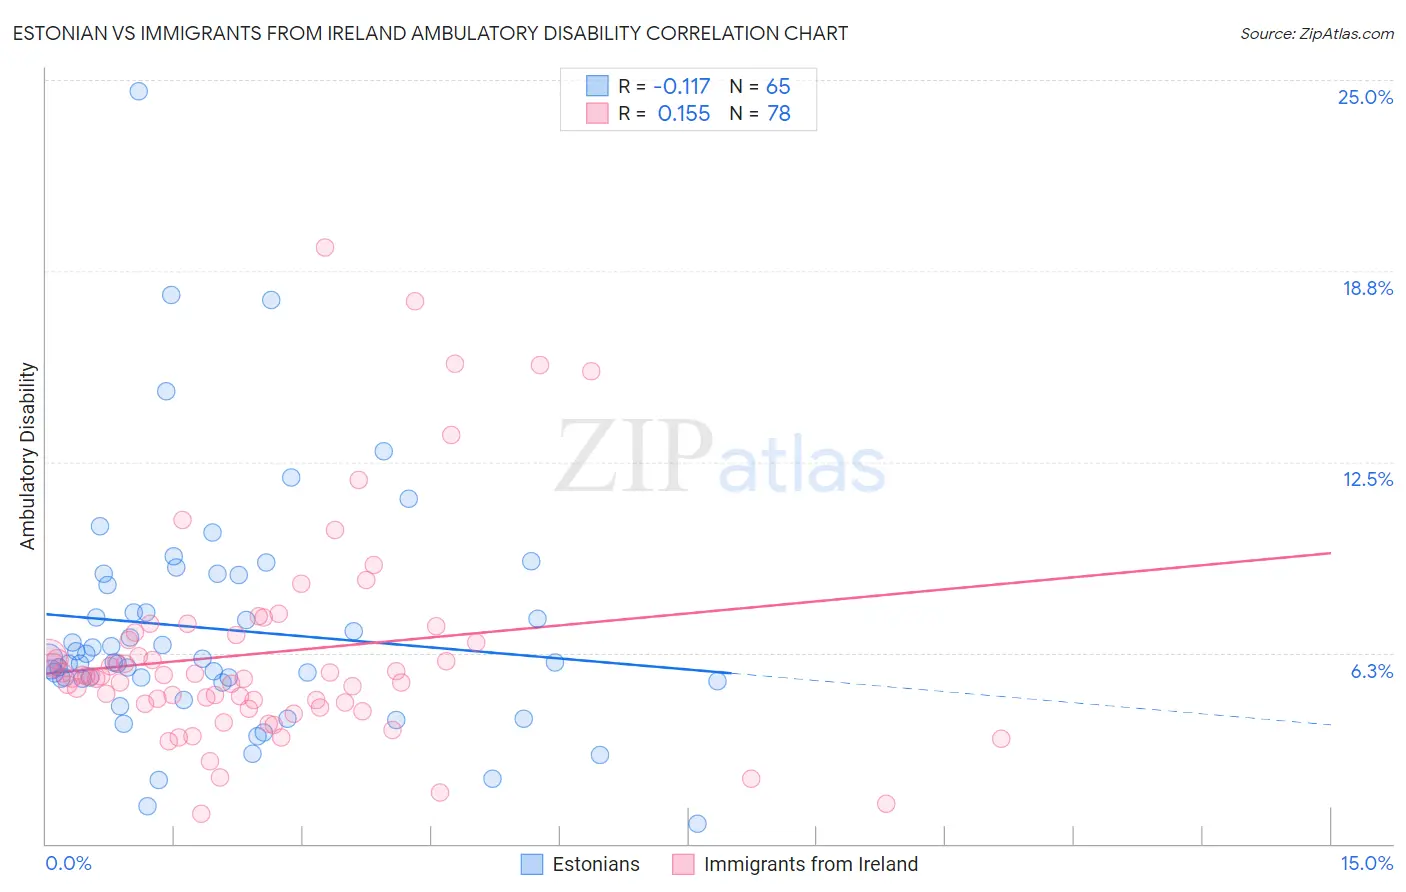
Estonian vs Immigrants from Ireland Ambulatory Disability Correlation Chart
The statistical analysis conducted on geographies consisting of 123,516,931 people shows a poor negative correlation between the proportion of Estonians and percentage of population with ambulatory disability in the United States with a correlation coefficient (R) of -0.117 and weighted average of 5.9%. Similarly, the statistical analysis conducted on geographies consisting of 240,763,505 people shows a poor positive correlation between the proportion of Immigrants from Ireland and percentage of population with ambulatory disability in the United States with a correlation coefficient (R) of 0.155 and weighted average of 5.7%, a difference of 3.1%.
Ambulatory Disability Correlation Summary
| Measurement | Estonian | Immigrants from Ireland |
| Minimum | 0.64% | 0.96% |
| Maximum | 24.6% | 19.5% |
| Range | 24.0% | 18.6% |
| Mean | 7.0% | 6.2% |
| Median | 5.9% | 5.5% |
| Interquartile 25% (IQ1) | 5.4% | 4.6% |
| Interquartile 75% (IQ3) | 8.6% | 6.8% |
| Interquartile Range (IQR) | 3.3% | 2.3% |
| Standard Deviation (Sample) | 4.0% | 3.5% |
| Standard Deviation (Population) | 3.9% | 3.5% |
Similar Demographics by Ambulatory Disability
Demographics Similar to Estonians by Ambulatory Disability
In terms of ambulatory disability, the demographic groups most similar to Estonians are Norwegian (5.9%, a difference of 0.040%), Costa Rican (5.9%, a difference of 0.070%), Icelander (5.9%, a difference of 0.070%), Immigrants from Russia (5.9%, a difference of 0.10%), and Russian (5.9%, a difference of 0.11%).
| Demographics | Rating | Rank | Ambulatory Disability |
| Immigrants | Uruguay | 95.6 /100 | #113 | Exceptional 5.9% |
| Immigrants | Poland | 95.4 /100 | #114 | Exceptional 5.9% |
| South American Indians | 94.8 /100 | #115 | Exceptional 5.9% |
| Immigrants | Africa | 94.7 /100 | #116 | Exceptional 5.9% |
| Immigrants | South Eastern Asia | 93.6 /100 | #117 | Exceptional 5.9% |
| Russians | 93.4 /100 | #118 | Exceptional 5.9% |
| Norwegians | 93.1 /100 | #119 | Exceptional 5.9% |
| Estonians | 92.9 /100 | #120 | Exceptional 5.9% |
| Costa Ricans | 92.6 /100 | #121 | Exceptional 5.9% |
| Icelanders | 92.6 /100 | #122 | Exceptional 5.9% |
| Immigrants | Russia | 92.4 /100 | #123 | Exceptional 5.9% |
| Immigrants | Middle Africa | 92.2 /100 | #124 | Exceptional 5.9% |
| Koreans | 91.6 /100 | #125 | Exceptional 5.9% |
| Arabs | 91.5 /100 | #126 | Exceptional 5.9% |
| Immigrants | Nigeria | 90.9 /100 | #127 | Exceptional 5.9% |
Demographics Similar to Immigrants from Ireland by Ambulatory Disability
In terms of ambulatory disability, the demographic groups most similar to Immigrants from Ireland are Immigrants from Jordan (5.7%, a difference of 0.010%), Palestinian (5.7%, a difference of 0.010%), Eastern European (5.7%, a difference of 0.030%), Ugandan (5.7%, a difference of 0.030%), and Chilean (5.7%, a difference of 0.13%).
| Demographics | Rating | Rank | Ambulatory Disability |
| Immigrants | Northern Africa | 99.4 /100 | #73 | Exceptional 5.7% |
| Immigrants | Cameroon | 99.4 /100 | #74 | Exceptional 5.7% |
| Immigrants | South Africa | 99.3 /100 | #75 | Exceptional 5.7% |
| Sudanese | 99.3 /100 | #76 | Exceptional 5.7% |
| Immigrants | Vietnam | 99.3 /100 | #77 | Exceptional 5.7% |
| Somalis | 99.2 /100 | #78 | Exceptional 5.7% |
| Chileans | 99.2 /100 | #79 | Exceptional 5.7% |
| Immigrants | Ireland | 99.2 /100 | #80 | Exceptional 5.7% |
| Immigrants | Jordan | 99.2 /100 | #81 | Exceptional 5.7% |
| Palestinians | 99.2 /100 | #82 | Exceptional 5.7% |
| Eastern Europeans | 99.2 /100 | #83 | Exceptional 5.7% |
| Ugandans | 99.2 /100 | #84 | Exceptional 5.7% |
| South Americans | 99.0 /100 | #85 | Exceptional 5.7% |
| Latvians | 99.0 /100 | #86 | Exceptional 5.7% |
| Immigrants | Chile | 98.9 /100 | #87 | Exceptional 5.8% |