Estonian vs Immigrants from Haiti Ambulatory Disability
COMPARE
Estonian
Immigrants from Haiti
Ambulatory Disability
Ambulatory Disability Comparison
Estonians
Immigrants from Haiti
5.9%
AMBULATORY DISABILITY
92.9/ 100
METRIC RATING
120th/ 347
METRIC RANK
6.5%
AMBULATORY DISABILITY
1.6/ 100
METRIC RATING
241st/ 347
METRIC RANK
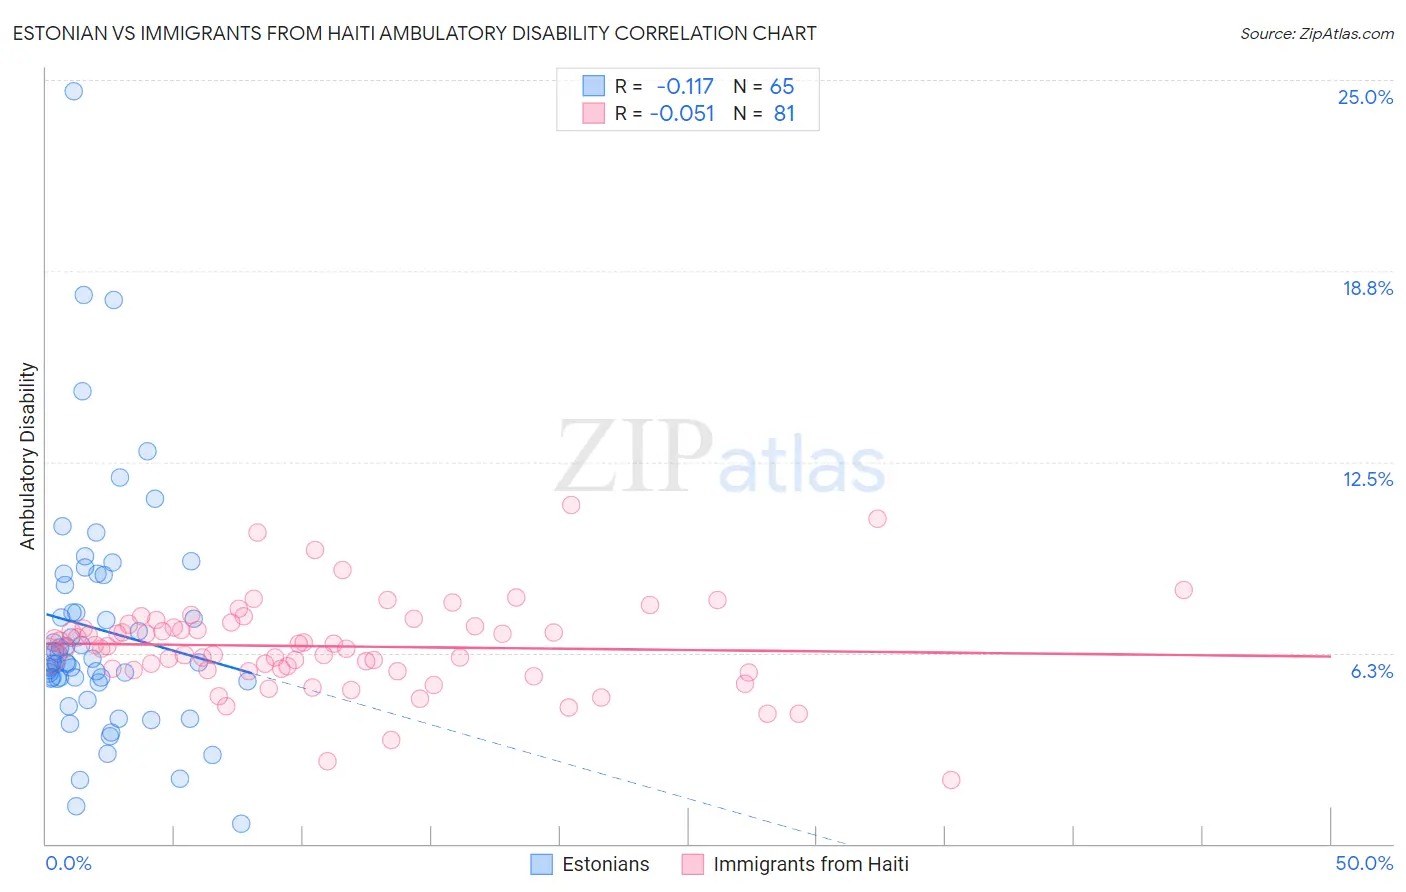
Estonian vs Immigrants from Haiti Ambulatory Disability Correlation Chart
The statistical analysis conducted on geographies consisting of 123,516,931 people shows a poor negative correlation between the proportion of Estonians and percentage of population with ambulatory disability in the United States with a correlation coefficient (R) of -0.117 and weighted average of 5.9%. Similarly, the statistical analysis conducted on geographies consisting of 225,209,570 people shows a slight negative correlation between the proportion of Immigrants from Haiti and percentage of population with ambulatory disability in the United States with a correlation coefficient (R) of -0.051 and weighted average of 6.5%, a difference of 9.2%.
Ambulatory Disability Correlation Summary
| Measurement | Estonian | Immigrants from Haiti |
| Minimum | 0.64% | 2.1% |
| Maximum | 24.6% | 11.1% |
| Range | 24.0% | 9.0% |
| Mean | 7.0% | 6.5% |
| Median | 5.9% | 6.5% |
| Interquartile 25% (IQ1) | 5.4% | 5.7% |
| Interquartile 75% (IQ3) | 8.6% | 7.2% |
| Interquartile Range (IQR) | 3.3% | 1.5% |
| Standard Deviation (Sample) | 4.0% | 1.5% |
| Standard Deviation (Population) | 3.9% | 1.5% |
Similar Demographics by Ambulatory Disability
Demographics Similar to Estonians by Ambulatory Disability
In terms of ambulatory disability, the demographic groups most similar to Estonians are Norwegian (5.9%, a difference of 0.040%), Costa Rican (5.9%, a difference of 0.070%), Icelander (5.9%, a difference of 0.070%), Immigrants from Russia (5.9%, a difference of 0.10%), and Russian (5.9%, a difference of 0.11%).
| Demographics | Rating | Rank | Ambulatory Disability |
| Immigrants | Uruguay | 95.6 /100 | #113 | Exceptional 5.9% |
| Immigrants | Poland | 95.4 /100 | #114 | Exceptional 5.9% |
| South American Indians | 94.8 /100 | #115 | Exceptional 5.9% |
| Immigrants | Africa | 94.7 /100 | #116 | Exceptional 5.9% |
| Immigrants | South Eastern Asia | 93.6 /100 | #117 | Exceptional 5.9% |
| Russians | 93.4 /100 | #118 | Exceptional 5.9% |
| Norwegians | 93.1 /100 | #119 | Exceptional 5.9% |
| Estonians | 92.9 /100 | #120 | Exceptional 5.9% |
| Costa Ricans | 92.6 /100 | #121 | Exceptional 5.9% |
| Icelanders | 92.6 /100 | #122 | Exceptional 5.9% |
| Immigrants | Russia | 92.4 /100 | #123 | Exceptional 5.9% |
| Immigrants | Middle Africa | 92.2 /100 | #124 | Exceptional 5.9% |
| Koreans | 91.6 /100 | #125 | Exceptional 5.9% |
| Arabs | 91.5 /100 | #126 | Exceptional 5.9% |
| Immigrants | Nigeria | 90.9 /100 | #127 | Exceptional 5.9% |
Demographics Similar to Immigrants from Haiti by Ambulatory Disability
In terms of ambulatory disability, the demographic groups most similar to Immigrants from Haiti are Spaniard (6.5%, a difference of 0.030%), German (6.5%, a difference of 0.050%), Immigrants from Panama (6.5%, a difference of 0.050%), Immigrants from Senegal (6.4%, a difference of 0.080%), and Tlingit-Haida (6.5%, a difference of 0.090%).
| Demographics | Rating | Rank | Ambulatory Disability |
| Immigrants | Liberia | 2.3 /100 | #234 | Tragic 6.4% |
| Hispanics or Latinos | 2.2 /100 | #235 | Tragic 6.4% |
| Dutch | 2.0 /100 | #236 | Tragic 6.4% |
| Immigrants | Germany | 1.8 /100 | #237 | Tragic 6.4% |
| Haitians | 1.8 /100 | #238 | Tragic 6.4% |
| Senegalese | 1.7 /100 | #239 | Tragic 6.4% |
| Immigrants | Senegal | 1.7 /100 | #240 | Tragic 6.4% |
| Immigrants | Haiti | 1.6 /100 | #241 | Tragic 6.5% |
| Spaniards | 1.6 /100 | #242 | Tragic 6.5% |
| Germans | 1.5 /100 | #243 | Tragic 6.5% |
| Immigrants | Panama | 1.5 /100 | #244 | Tragic 6.5% |
| Tlingit-Haida | 1.5 /100 | #245 | Tragic 6.5% |
| Armenians | 1.5 /100 | #246 | Tragic 6.5% |
| Immigrants | Cuba | 1.4 /100 | #247 | Tragic 6.5% |
| Immigrants | Portugal | 1.4 /100 | #248 | Tragic 6.5% |