Delaware vs Immigrants from Sweden In Labor Force | Age 45-54
COMPARE
Delaware
Immigrants from Sweden
In Labor Force | Age 45-54
In Labor Force | Age 45-54 Comparison
Delaware
Immigrants from Sweden
80.8%
IN LABOR FORCE | AGE 45-54
0.0/ 100
METRIC RATING
285th/ 347
METRIC RANK
82.9%
IN LABOR FORCE | AGE 45-54
73.3/ 100
METRIC RATING
149th/ 347
METRIC RANK
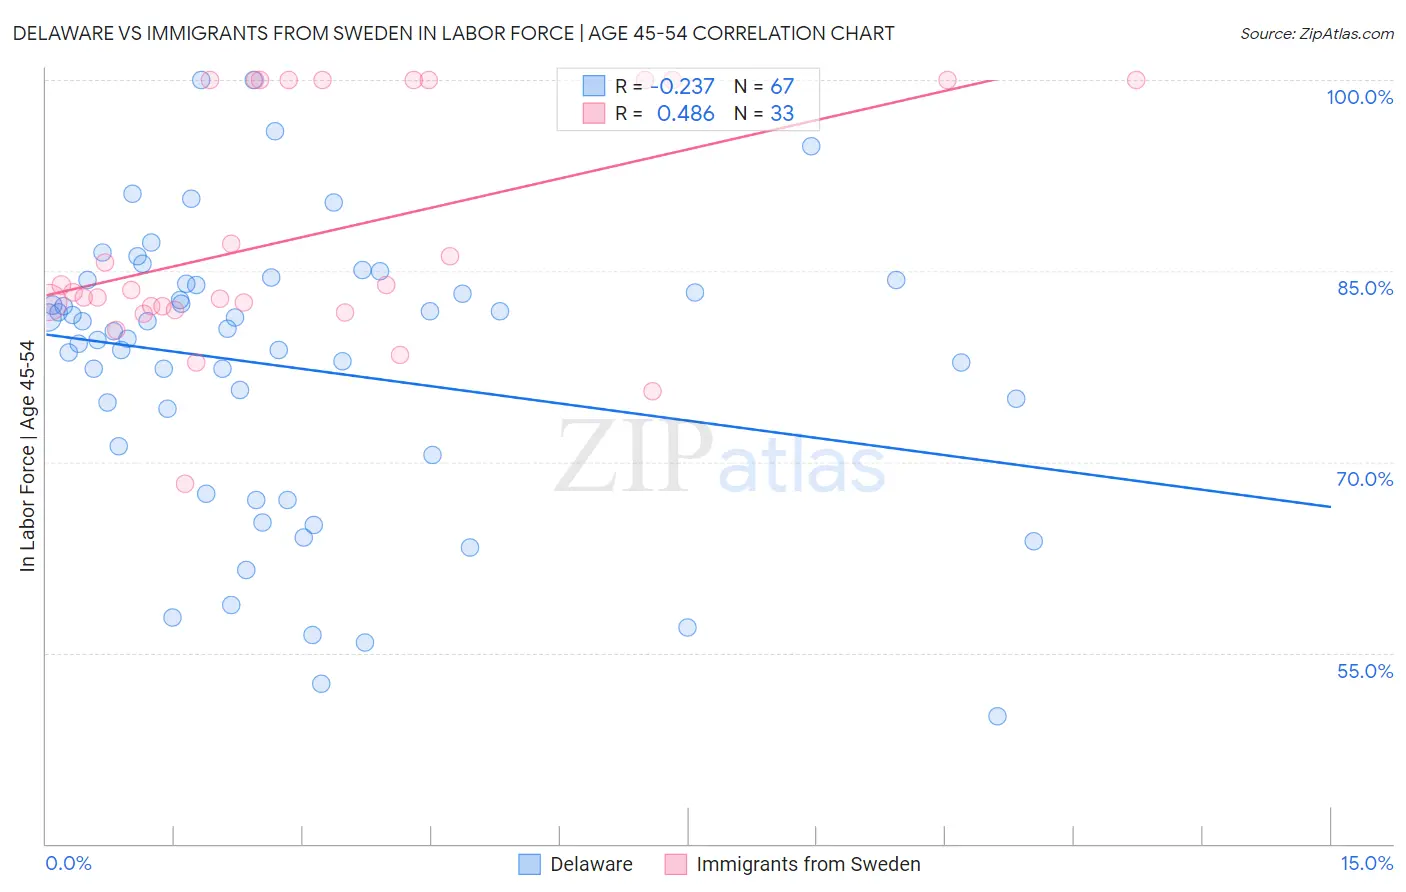
Delaware vs Immigrants from Sweden In Labor Force | Age 45-54 Correlation Chart
The statistical analysis conducted on geographies consisting of 96,219,228 people shows a weak negative correlation between the proportion of Delaware and labor force participation rate among population between the ages 45 and 54 in the United States with a correlation coefficient (R) of -0.237 and weighted average of 80.8%. Similarly, the statistical analysis conducted on geographies consisting of 164,697,999 people shows a moderate positive correlation between the proportion of Immigrants from Sweden and labor force participation rate among population between the ages 45 and 54 in the United States with a correlation coefficient (R) of 0.486 and weighted average of 82.9%, a difference of 2.7%.
In Labor Force | Age 45-54 Correlation Summary
| Measurement | Delaware | Immigrants from Sweden |
| Minimum | 50.0% | 68.3% |
| Maximum | 100.0% | 100.0% |
| Range | 50.0% | 31.7% |
| Mean | 77.4% | 87.8% |
| Median | 80.2% | 83.5% |
| Interquartile 25% (IQ1) | 70.5% | 82.1% |
| Interquartile 75% (IQ3) | 84.0% | 100.0% |
| Interquartile Range (IQR) | 13.5% | 17.9% |
| Standard Deviation (Sample) | 11.1% | 9.3% |
| Standard Deviation (Population) | 11.0% | 9.2% |
Similar Demographics by In Labor Force | Age 45-54
Demographics Similar to Delaware by In Labor Force | Age 45-54
In terms of in labor force | age 45-54, the demographic groups most similar to Delaware are Belizean (80.8%, a difference of 0.010%), Immigrants from Dominica (80.8%, a difference of 0.010%), Vietnamese (80.8%, a difference of 0.010%), Cree (80.8%, a difference of 0.010%), and Immigrants from Bangladesh (80.7%, a difference of 0.040%).
| Demographics | Rating | Rank | In Labor Force | Age 45-54 |
| Immigrants | Guatemala | 0.0 /100 | #278 | Tragic 81.1% |
| Immigrants | Micronesia | 0.0 /100 | #279 | Tragic 81.1% |
| Immigrants | Latin America | 0.0 /100 | #280 | Tragic 81.0% |
| Immigrants | Grenada | 0.0 /100 | #281 | Tragic 81.0% |
| Aleuts | 0.0 /100 | #282 | Tragic 81.0% |
| French American Indians | 0.0 /100 | #283 | Tragic 80.8% |
| Belizeans | 0.0 /100 | #284 | Tragic 80.8% |
| Delaware | 0.0 /100 | #285 | Tragic 80.8% |
| Immigrants | Dominica | 0.0 /100 | #286 | Tragic 80.8% |
| Vietnamese | 0.0 /100 | #287 | Tragic 80.8% |
| Cree | 0.0 /100 | #288 | Tragic 80.8% |
| Immigrants | Bangladesh | 0.0 /100 | #289 | Tragic 80.7% |
| Mexican American Indians | 0.0 /100 | #290 | Tragic 80.7% |
| Immigrants | Belize | 0.0 /100 | #291 | Tragic 80.6% |
| Iroquois | 0.0 /100 | #292 | Tragic 80.6% |
Demographics Similar to Immigrants from Sweden by In Labor Force | Age 45-54
In terms of in labor force | age 45-54, the demographic groups most similar to Immigrants from Sweden are Immigrants from Nigeria (83.0%, a difference of 0.010%), Immigrants from Netherlands (82.9%, a difference of 0.010%), Korean (82.9%, a difference of 0.010%), Romanian (83.0%, a difference of 0.020%), and Immigrants from France (83.0%, a difference of 0.020%).
| Demographics | Rating | Rank | In Labor Force | Age 45-54 |
| Immigrants | Scotland | 77.8 /100 | #142 | Good 83.0% |
| Okinawans | 77.0 /100 | #143 | Good 83.0% |
| Soviet Union | 76.8 /100 | #144 | Good 83.0% |
| Romanians | 75.4 /100 | #145 | Good 83.0% |
| Immigrants | France | 75.3 /100 | #146 | Good 83.0% |
| Czechoslovakians | 74.8 /100 | #147 | Good 83.0% |
| Immigrants | Nigeria | 74.1 /100 | #148 | Good 83.0% |
| Immigrants | Sweden | 73.3 /100 | #149 | Good 82.9% |
| Immigrants | Netherlands | 72.6 /100 | #150 | Good 82.9% |
| Koreans | 71.9 /100 | #151 | Good 82.9% |
| Slavs | 71.5 /100 | #152 | Good 82.9% |
| Immigrants | Indonesia | 70.6 /100 | #153 | Good 82.9% |
| Immigrants | Ghana | 70.3 /100 | #154 | Good 82.9% |
| Immigrants | Philippines | 69.0 /100 | #155 | Good 82.9% |
| Immigrants | Saudi Arabia | 68.8 /100 | #156 | Good 82.9% |