Immigrants from Cameroon vs Immigrants from Sweden Disability Age Under 5
COMPARE
Immigrants from Cameroon
Immigrants from Sweden
Disability Age Under 5
Disability Age Under 5 Comparison
Immigrants from Cameroon
Immigrants from Sweden
1.4%
DISABILITY AGE UNDER 5
1.7/ 100
METRIC RATING
243rd/ 347
METRIC RANK
1.1%
DISABILITY AGE UNDER 5
99.8/ 100
METRIC RATING
47th/ 347
METRIC RANK
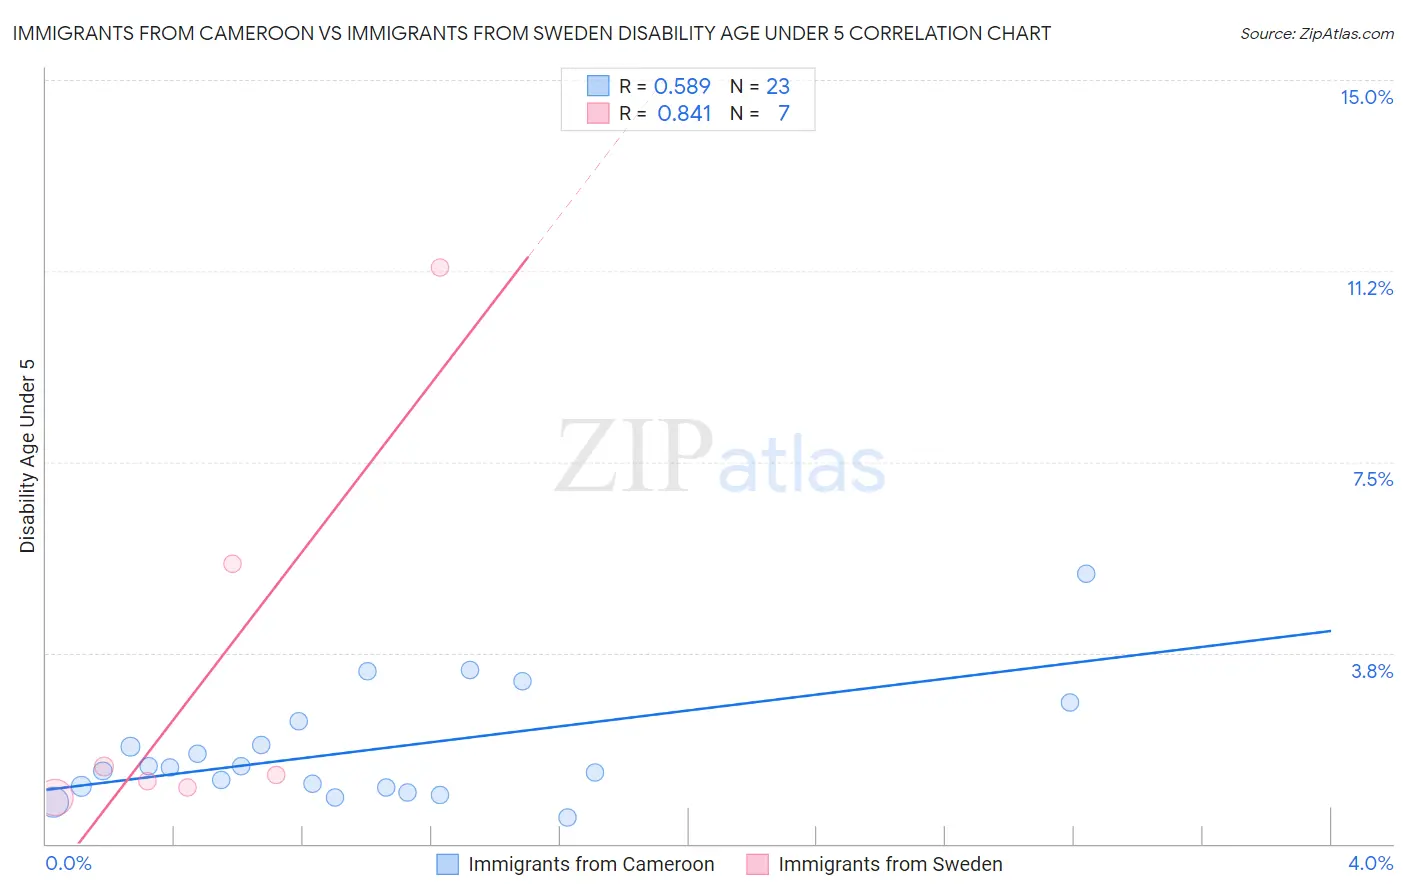
Immigrants from Cameroon vs Immigrants from Sweden Disability Age Under 5 Correlation Chart
The statistical analysis conducted on geographies consisting of 95,639,339 people shows a substantial positive correlation between the proportion of Immigrants from Cameroon and percentage of population with a disability under the age of 5 in the United States with a correlation coefficient (R) of 0.589 and weighted average of 1.4%. Similarly, the statistical analysis conducted on geographies consisting of 109,268,889 people shows a very strong positive correlation between the proportion of Immigrants from Sweden and percentage of population with a disability under the age of 5 in the United States with a correlation coefficient (R) of 0.841 and weighted average of 1.1%, a difference of 26.4%.
Disability Age Under 5 Correlation Summary
| Measurement | Immigrants from Cameroon | Immigrants from Sweden |
| Minimum | 0.51% | 0.92% |
| Maximum | 5.3% | 11.3% |
| Range | 4.8% | 10.4% |
| Mean | 1.8% | 3.3% |
| Median | 1.5% | 1.4% |
| Interquartile 25% (IQ1) | 1.1% | 1.1% |
| Interquartile 75% (IQ3) | 2.4% | 5.5% |
| Interquartile Range (IQR) | 1.3% | 4.4% |
| Standard Deviation (Sample) | 1.1% | 3.9% |
| Standard Deviation (Population) | 1.1% | 3.6% |
Similar Demographics by Disability Age Under 5
Demographics Similar to Immigrants from Cameroon by Disability Age Under 5
In terms of disability age under 5, the demographic groups most similar to Immigrants from Cameroon are Lumbee (1.3%, a difference of 0.38%), Spaniard (1.4%, a difference of 0.43%), Maltese (1.3%, a difference of 0.46%), Native Hawaiian (1.3%, a difference of 0.53%), and Immigrants from Austria (1.3%, a difference of 0.56%).
| Demographics | Rating | Rank | Disability Age Under 5 |
| South American Indians | 3.3 /100 | #236 | Tragic 1.3% |
| Basques | 3.0 /100 | #237 | Tragic 1.3% |
| Spanish American Indians | 2.4 /100 | #238 | Tragic 1.3% |
| Immigrants | Austria | 2.3 /100 | #239 | Tragic 1.3% |
| Native Hawaiians | 2.2 /100 | #240 | Tragic 1.3% |
| Maltese | 2.2 /100 | #241 | Tragic 1.3% |
| Lumbee | 2.1 /100 | #242 | Tragic 1.3% |
| Immigrants | Cameroon | 1.7 /100 | #243 | Tragic 1.4% |
| Spaniards | 1.4 /100 | #244 | Tragic 1.4% |
| Potawatomi | 1.1 /100 | #245 | Tragic 1.4% |
| Russians | 1.0 /100 | #246 | Tragic 1.4% |
| Immigrants | England | 1.0 /100 | #247 | Tragic 1.4% |
| Eastern Europeans | 1.0 /100 | #248 | Tragic 1.4% |
| Bermudans | 1.0 /100 | #249 | Tragic 1.4% |
| Africans | 1.0 /100 | #250 | Tragic 1.4% |
Demographics Similar to Immigrants from Sweden by Disability Age Under 5
In terms of disability age under 5, the demographic groups most similar to Immigrants from Sweden are Immigrants from Congo (1.1%, a difference of 0.14%), Immigrants from Singapore (1.1%, a difference of 0.22%), Immigrants from Russia (1.1%, a difference of 0.43%), Immigrants from Japan (1.1%, a difference of 0.44%), and Immigrants from Turkey (1.1%, a difference of 0.54%).
| Demographics | Rating | Rank | Disability Age Under 5 |
| Immigrants | Albania | 99.9 /100 | #40 | Exceptional 1.1% |
| Thais | 99.8 /100 | #41 | Exceptional 1.1% |
| Immigrants | Bulgaria | 99.8 /100 | #42 | Exceptional 1.1% |
| Pima | 99.8 /100 | #43 | Exceptional 1.1% |
| Immigrants | Asia | 99.8 /100 | #44 | Exceptional 1.1% |
| Immigrants | Turkey | 99.8 /100 | #45 | Exceptional 1.1% |
| Immigrants | Congo | 99.8 /100 | #46 | Exceptional 1.1% |
| Immigrants | Sweden | 99.8 /100 | #47 | Exceptional 1.1% |
| Immigrants | Singapore | 99.7 /100 | #48 | Exceptional 1.1% |
| Immigrants | Russia | 99.7 /100 | #49 | Exceptional 1.1% |
| Immigrants | Japan | 99.7 /100 | #50 | Exceptional 1.1% |
| Immigrants | Kazakhstan | 99.7 /100 | #51 | Exceptional 1.1% |
| Immigrants | Bolivia | 99.6 /100 | #52 | Exceptional 1.1% |
| Asians | 99.6 /100 | #53 | Exceptional 1.1% |
| Immigrants | El Salvador | 99.6 /100 | #54 | Exceptional 1.1% |