Danish vs Central American Ambulatory Disability
COMPARE
Danish
Central American
Ambulatory Disability
Ambulatory Disability Comparison
Danes
Central Americans
5.8%
AMBULATORY DISABILITY
96.6/ 100
METRIC RATING
111th/ 347
METRIC RANK
6.0%
AMBULATORY DISABILITY
69.8/ 100
METRIC RATING
160th/ 347
METRIC RANK
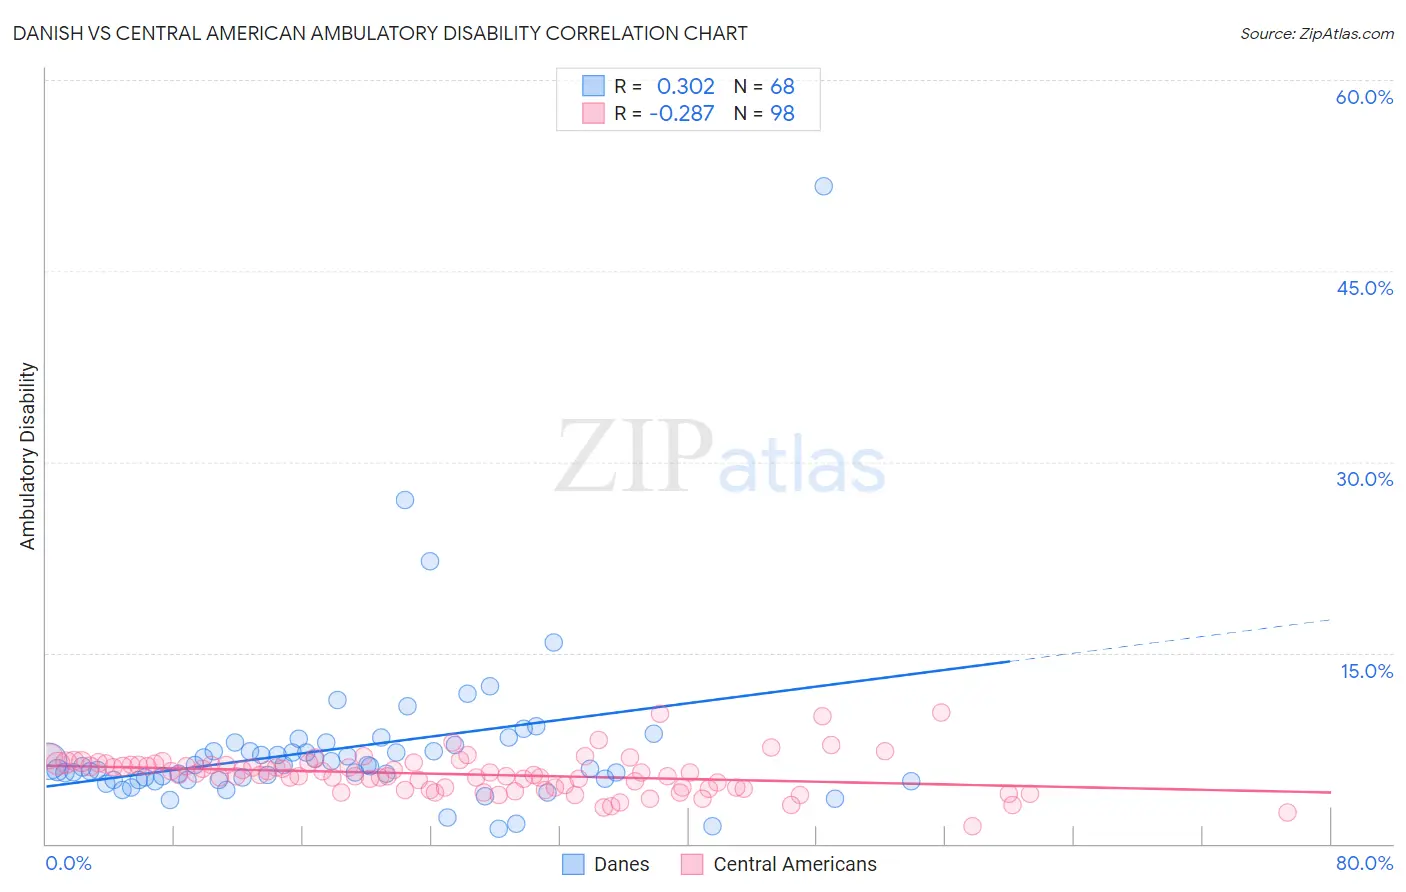
Danish vs Central American Ambulatory Disability Correlation Chart
The statistical analysis conducted on geographies consisting of 473,952,893 people shows a mild positive correlation between the proportion of Danes and percentage of population with ambulatory disability in the United States with a correlation coefficient (R) of 0.302 and weighted average of 5.8%. Similarly, the statistical analysis conducted on geographies consisting of 504,305,341 people shows a weak negative correlation between the proportion of Central Americans and percentage of population with ambulatory disability in the United States with a correlation coefficient (R) of -0.287 and weighted average of 6.0%, a difference of 3.5%.
Ambulatory Disability Correlation Summary
| Measurement | Danish | Central American |
| Minimum | 1.2% | 1.3% |
| Maximum | 51.6% | 10.3% |
| Range | 50.4% | 9.0% |
| Mean | 7.5% | 5.5% |
| Median | 6.1% | 5.4% |
| Interquartile 25% (IQ1) | 5.0% | 4.4% |
| Interquartile 75% (IQ3) | 7.5% | 6.2% |
| Interquartile Range (IQR) | 2.5% | 1.9% |
| Standard Deviation (Sample) | 6.7% | 1.5% |
| Standard Deviation (Population) | 6.7% | 1.5% |
Similar Demographics by Ambulatory Disability
Demographics Similar to Danes by Ambulatory Disability
In terms of ambulatory disability, the demographic groups most similar to Danes are Immigrants from Colombia (5.8%, a difference of 0.070%), South African (5.9%, a difference of 0.13%), Immigrants from Netherlands (5.8%, a difference of 0.25%), Colombian (5.8%, a difference of 0.27%), and Uruguayan (5.8%, a difference of 0.28%).
| Demographics | Rating | Rank | Ambulatory Disability |
| New Zealanders | 97.6 /100 | #104 | Exceptional 5.8% |
| Immigrants | Czechoslovakia | 97.4 /100 | #105 | Exceptional 5.8% |
| Immigrants | Morocco | 97.3 /100 | #106 | Exceptional 5.8% |
| Uruguayans | 97.2 /100 | #107 | Exceptional 5.8% |
| Colombians | 97.2 /100 | #108 | Exceptional 5.8% |
| Immigrants | Netherlands | 97.1 /100 | #109 | Exceptional 5.8% |
| Immigrants | Colombia | 96.7 /100 | #110 | Exceptional 5.8% |
| Danes | 96.6 /100 | #111 | Exceptional 5.8% |
| South Africans | 96.3 /100 | #112 | Exceptional 5.9% |
| Immigrants | Uruguay | 95.6 /100 | #113 | Exceptional 5.9% |
| Immigrants | Poland | 95.4 /100 | #114 | Exceptional 5.9% |
| South American Indians | 94.8 /100 | #115 | Exceptional 5.9% |
| Immigrants | Africa | 94.7 /100 | #116 | Exceptional 5.9% |
| Immigrants | South Eastern Asia | 93.6 /100 | #117 | Exceptional 5.9% |
| Russians | 93.4 /100 | #118 | Exceptional 5.9% |
Demographics Similar to Central Americans by Ambulatory Disability
In terms of ambulatory disability, the demographic groups most similar to Central Americans are Immigrants from Belarus (6.1%, a difference of 0.040%), Immigrants from Fiji (6.0%, a difference of 0.080%), Immigrants from Latvia (6.0%, a difference of 0.080%), Ghanaian (6.0%, a difference of 0.10%), and Northern European (6.0%, a difference of 0.13%).
| Demographics | Rating | Rank | Ambulatory Disability |
| Syrians | 75.5 /100 | #153 | Good 6.0% |
| Immigrants | Croatia | 75.1 /100 | #154 | Good 6.0% |
| Immigrants | Scotland | 72.1 /100 | #155 | Good 6.0% |
| Northern Europeans | 71.8 /100 | #156 | Good 6.0% |
| Ghanaians | 71.3 /100 | #157 | Good 6.0% |
| Immigrants | Fiji | 71.2 /100 | #158 | Good 6.0% |
| Immigrants | Latvia | 71.1 /100 | #159 | Good 6.0% |
| Central Americans | 69.8 /100 | #160 | Good 6.0% |
| Immigrants | Belarus | 69.2 /100 | #161 | Good 6.1% |
| Nigerians | 67.1 /100 | #162 | Good 6.1% |
| Lebanese | 66.2 /100 | #163 | Good 6.1% |
| Basques | 63.7 /100 | #164 | Good 6.1% |
| Nicaraguans | 63.2 /100 | #165 | Good 6.1% |
| Iraqis | 62.8 /100 | #166 | Good 6.1% |
| Immigrants | Oceania | 60.7 /100 | #167 | Good 6.1% |