Danish vs Dutch Ambulatory Disability
COMPARE
Danish
Dutch
Ambulatory Disability
Ambulatory Disability Comparison
Danes
Dutch
5.8%
AMBULATORY DISABILITY
96.6/ 100
METRIC RATING
111th/ 347
METRIC RANK
6.4%
AMBULATORY DISABILITY
2.0/ 100
METRIC RATING
236th/ 347
METRIC RANK
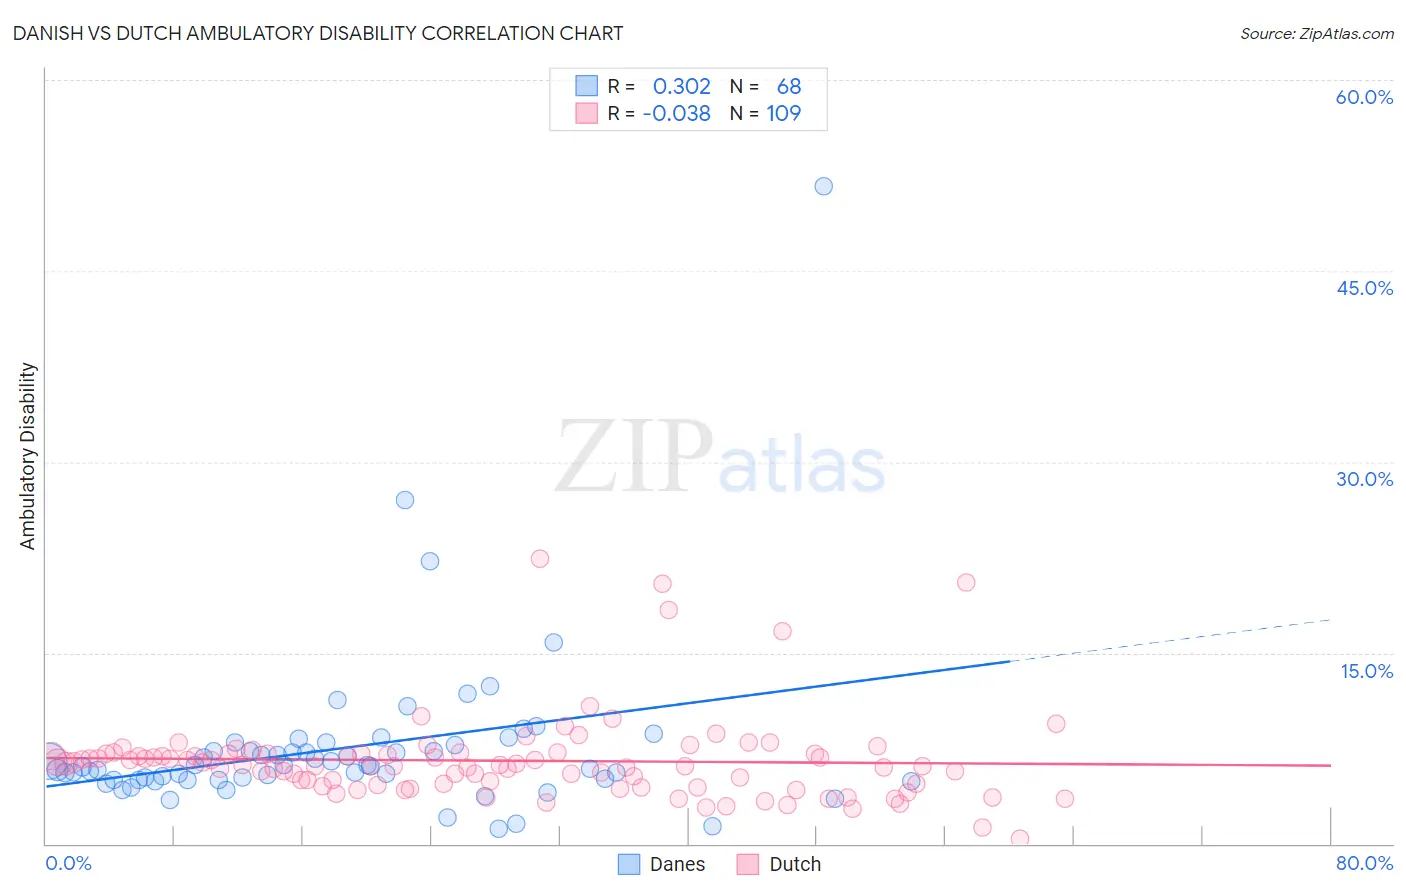
Danish vs Dutch Ambulatory Disability Correlation Chart
The statistical analysis conducted on geographies consisting of 473,952,893 people shows a mild positive correlation between the proportion of Danes and percentage of population with ambulatory disability in the United States with a correlation coefficient (R) of 0.302 and weighted average of 5.8%. Similarly, the statistical analysis conducted on geographies consisting of 553,973,696 people shows no correlation between the proportion of Dutch and percentage of population with ambulatory disability in the United States with a correlation coefficient (R) of -0.038 and weighted average of 6.4%, a difference of 10.1%.
Ambulatory Disability Correlation Summary
| Measurement | Danish | Dutch |
| Minimum | 1.2% | 0.40% |
| Maximum | 51.6% | 22.4% |
| Range | 50.4% | 22.0% |
| Mean | 7.5% | 6.5% |
| Median | 6.1% | 6.2% |
| Interquartile 25% (IQ1) | 5.0% | 4.7% |
| Interquartile 75% (IQ3) | 7.5% | 7.1% |
| Interquartile Range (IQR) | 2.5% | 2.4% |
| Standard Deviation (Sample) | 6.7% | 3.4% |
| Standard Deviation (Population) | 6.7% | 3.4% |
Similar Demographics by Ambulatory Disability
Demographics Similar to Danes by Ambulatory Disability
In terms of ambulatory disability, the demographic groups most similar to Danes are Immigrants from Colombia (5.8%, a difference of 0.070%), South African (5.9%, a difference of 0.13%), Immigrants from Netherlands (5.8%, a difference of 0.25%), Colombian (5.8%, a difference of 0.27%), and Uruguayan (5.8%, a difference of 0.28%).
| Demographics | Rating | Rank | Ambulatory Disability |
| New Zealanders | 97.6 /100 | #104 | Exceptional 5.8% |
| Immigrants | Czechoslovakia | 97.4 /100 | #105 | Exceptional 5.8% |
| Immigrants | Morocco | 97.3 /100 | #106 | Exceptional 5.8% |
| Uruguayans | 97.2 /100 | #107 | Exceptional 5.8% |
| Colombians | 97.2 /100 | #108 | Exceptional 5.8% |
| Immigrants | Netherlands | 97.1 /100 | #109 | Exceptional 5.8% |
| Immigrants | Colombia | 96.7 /100 | #110 | Exceptional 5.8% |
| Danes | 96.6 /100 | #111 | Exceptional 5.8% |
| South Africans | 96.3 /100 | #112 | Exceptional 5.9% |
| Immigrants | Uruguay | 95.6 /100 | #113 | Exceptional 5.9% |
| Immigrants | Poland | 95.4 /100 | #114 | Exceptional 5.9% |
| South American Indians | 94.8 /100 | #115 | Exceptional 5.9% |
| Immigrants | Africa | 94.7 /100 | #116 | Exceptional 5.9% |
| Immigrants | South Eastern Asia | 93.6 /100 | #117 | Exceptional 5.9% |
| Russians | 93.4 /100 | #118 | Exceptional 5.9% |
Demographics Similar to Dutch by Ambulatory Disability
In terms of ambulatory disability, the demographic groups most similar to Dutch are Immigrants from Germany (6.4%, a difference of 0.090%), Haitian (6.4%, a difference of 0.10%), Hispanic or Latino (6.4%, a difference of 0.15%), Senegalese (6.4%, a difference of 0.16%), and Immigrants from Liberia (6.4%, a difference of 0.18%).
| Demographics | Rating | Rank | Ambulatory Disability |
| Czechoslovakians | 3.8 /100 | #229 | Tragic 6.4% |
| Mexicans | 3.5 /100 | #230 | Tragic 6.4% |
| Panamanians | 3.1 /100 | #231 | Tragic 6.4% |
| Assyrians/Chaldeans/Syriacs | 2.4 /100 | #232 | Tragic 6.4% |
| Sub-Saharan Africans | 2.3 /100 | #233 | Tragic 6.4% |
| Immigrants | Liberia | 2.3 /100 | #234 | Tragic 6.4% |
| Hispanics or Latinos | 2.2 /100 | #235 | Tragic 6.4% |
| Dutch | 2.0 /100 | #236 | Tragic 6.4% |
| Immigrants | Germany | 1.8 /100 | #237 | Tragic 6.4% |
| Haitians | 1.8 /100 | #238 | Tragic 6.4% |
| Senegalese | 1.7 /100 | #239 | Tragic 6.4% |
| Immigrants | Senegal | 1.7 /100 | #240 | Tragic 6.4% |
| Immigrants | Haiti | 1.6 /100 | #241 | Tragic 6.5% |
| Spaniards | 1.6 /100 | #242 | Tragic 6.5% |
| Germans | 1.5 /100 | #243 | Tragic 6.5% |