Immigrants from Ecuador vs Central American Ambulatory Disability
COMPARE
Immigrants from Ecuador
Central American
Ambulatory Disability
Ambulatory Disability Comparison
Immigrants from Ecuador
Central Americans
6.1%
AMBULATORY DISABILITY
53.8/ 100
METRIC RATING
170th/ 347
METRIC RANK
6.0%
AMBULATORY DISABILITY
69.8/ 100
METRIC RATING
160th/ 347
METRIC RANK
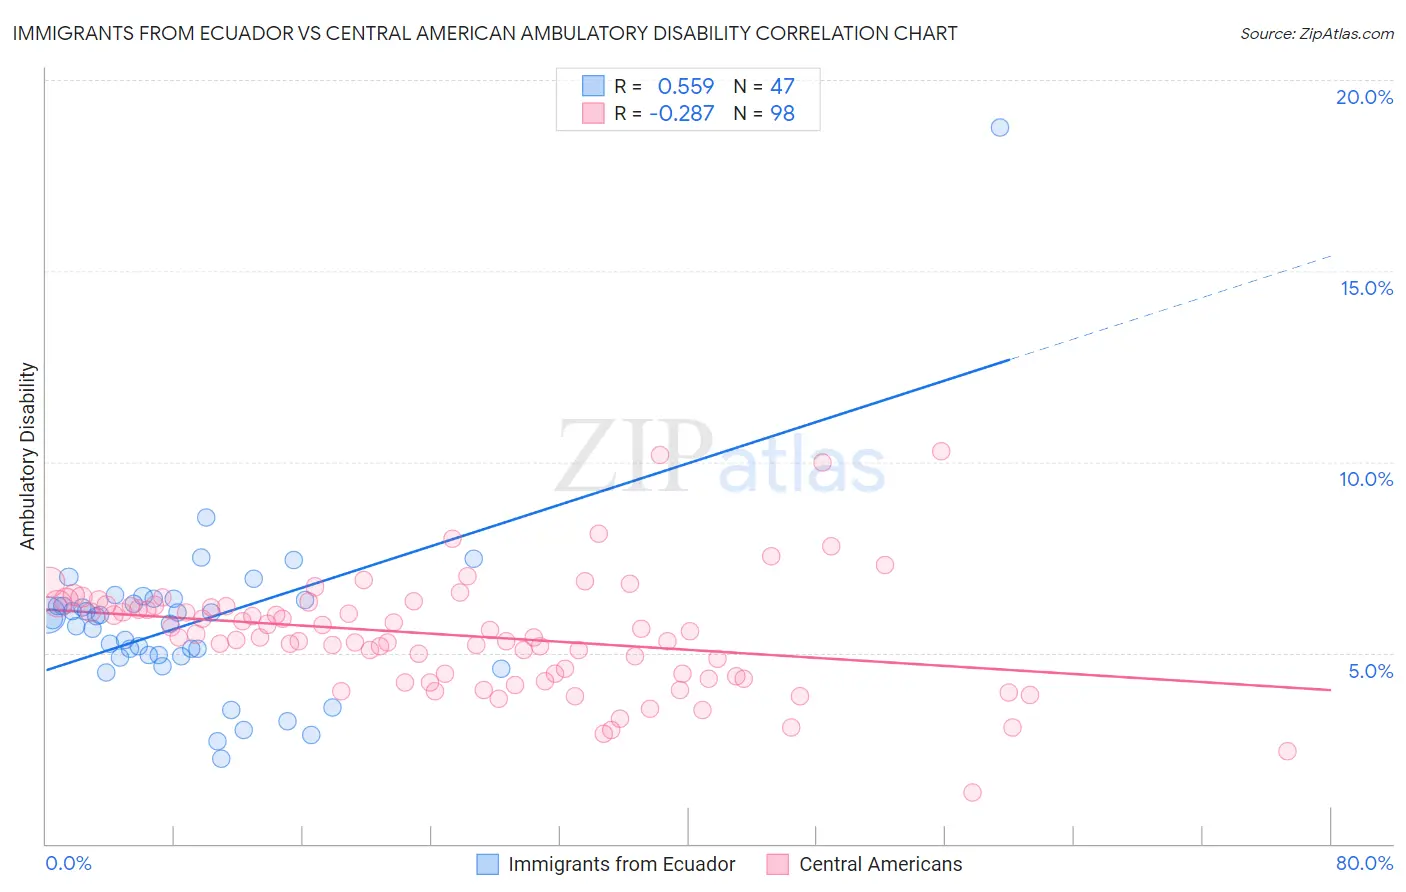
Immigrants from Ecuador vs Central American Ambulatory Disability Correlation Chart
The statistical analysis conducted on geographies consisting of 270,935,255 people shows a substantial positive correlation between the proportion of Immigrants from Ecuador and percentage of population with ambulatory disability in the United States with a correlation coefficient (R) of 0.559 and weighted average of 6.1%. Similarly, the statistical analysis conducted on geographies consisting of 504,305,341 people shows a weak negative correlation between the proportion of Central Americans and percentage of population with ambulatory disability in the United States with a correlation coefficient (R) of -0.287 and weighted average of 6.0%, a difference of 0.92%.
Ambulatory Disability Correlation Summary
| Measurement | Immigrants from Ecuador | Central American |
| Minimum | 2.2% | 1.3% |
| Maximum | 18.8% | 10.3% |
| Range | 16.5% | 9.0% |
| Mean | 5.8% | 5.5% |
| Median | 5.9% | 5.4% |
| Interquartile 25% (IQ1) | 4.9% | 4.4% |
| Interquartile 75% (IQ3) | 6.4% | 6.2% |
| Interquartile Range (IQR) | 1.5% | 1.9% |
| Standard Deviation (Sample) | 2.4% | 1.5% |
| Standard Deviation (Population) | 2.3% | 1.5% |
Demographics Similar to Immigrants from Ecuador and Central Americans by Ambulatory Disability
In terms of ambulatory disability, the demographic groups most similar to Immigrants from Ecuador are Moroccan (6.1%, a difference of 0.070%), Immigrants from Burma/Myanmar (6.1%, a difference of 0.090%), Croatian (6.1%, a difference of 0.14%), Immigrants from Canada (6.1%, a difference of 0.20%), and Immigrants from Southern Europe (6.1%, a difference of 0.23%). Similarly, the demographic groups most similar to Central Americans are Immigrants from Belarus (6.1%, a difference of 0.040%), Immigrants from Fiji (6.0%, a difference of 0.080%), Immigrants from Latvia (6.0%, a difference of 0.080%), Ghanaian (6.0%, a difference of 0.10%), and Northern European (6.0%, a difference of 0.13%).
| Demographics | Rating | Rank | Ambulatory Disability |
| Immigrants | Scotland | 72.1 /100 | #155 | Good 6.0% |
| Northern Europeans | 71.8 /100 | #156 | Good 6.0% |
| Ghanaians | 71.3 /100 | #157 | Good 6.0% |
| Immigrants | Fiji | 71.2 /100 | #158 | Good 6.0% |
| Immigrants | Latvia | 71.1 /100 | #159 | Good 6.0% |
| Central Americans | 69.8 /100 | #160 | Good 6.0% |
| Immigrants | Belarus | 69.2 /100 | #161 | Good 6.1% |
| Nigerians | 67.1 /100 | #162 | Good 6.1% |
| Lebanese | 66.2 /100 | #163 | Good 6.1% |
| Basques | 63.7 /100 | #164 | Good 6.1% |
| Nicaraguans | 63.2 /100 | #165 | Good 6.1% |
| Iraqis | 62.8 /100 | #166 | Good 6.1% |
| Immigrants | Oceania | 60.7 /100 | #167 | Good 6.1% |
| Ecuadorians | 60.5 /100 | #168 | Good 6.1% |
| Immigrants | Southern Europe | 58.1 /100 | #169 | Average 6.1% |
| Immigrants | Ecuador | 53.8 /100 | #170 | Average 6.1% |
| Moroccans | 52.6 /100 | #171 | Average 6.1% |
| Immigrants | Burma/Myanmar | 52.2 /100 | #172 | Average 6.1% |
| Croatians | 51.2 /100 | #173 | Average 6.1% |
| Immigrants | Canada | 50.0 /100 | #174 | Average 6.1% |
| Vietnamese | 47.2 /100 | #175 | Average 6.1% |