Australian vs Central American Ambulatory Disability
COMPARE
Australian
Central American
Ambulatory Disability
Ambulatory Disability Comparison
Australians
Central Americans
5.8%
AMBULATORY DISABILITY
98.8/ 100
METRIC RATING
90th/ 347
METRIC RANK
6.0%
AMBULATORY DISABILITY
69.8/ 100
METRIC RATING
160th/ 347
METRIC RANK
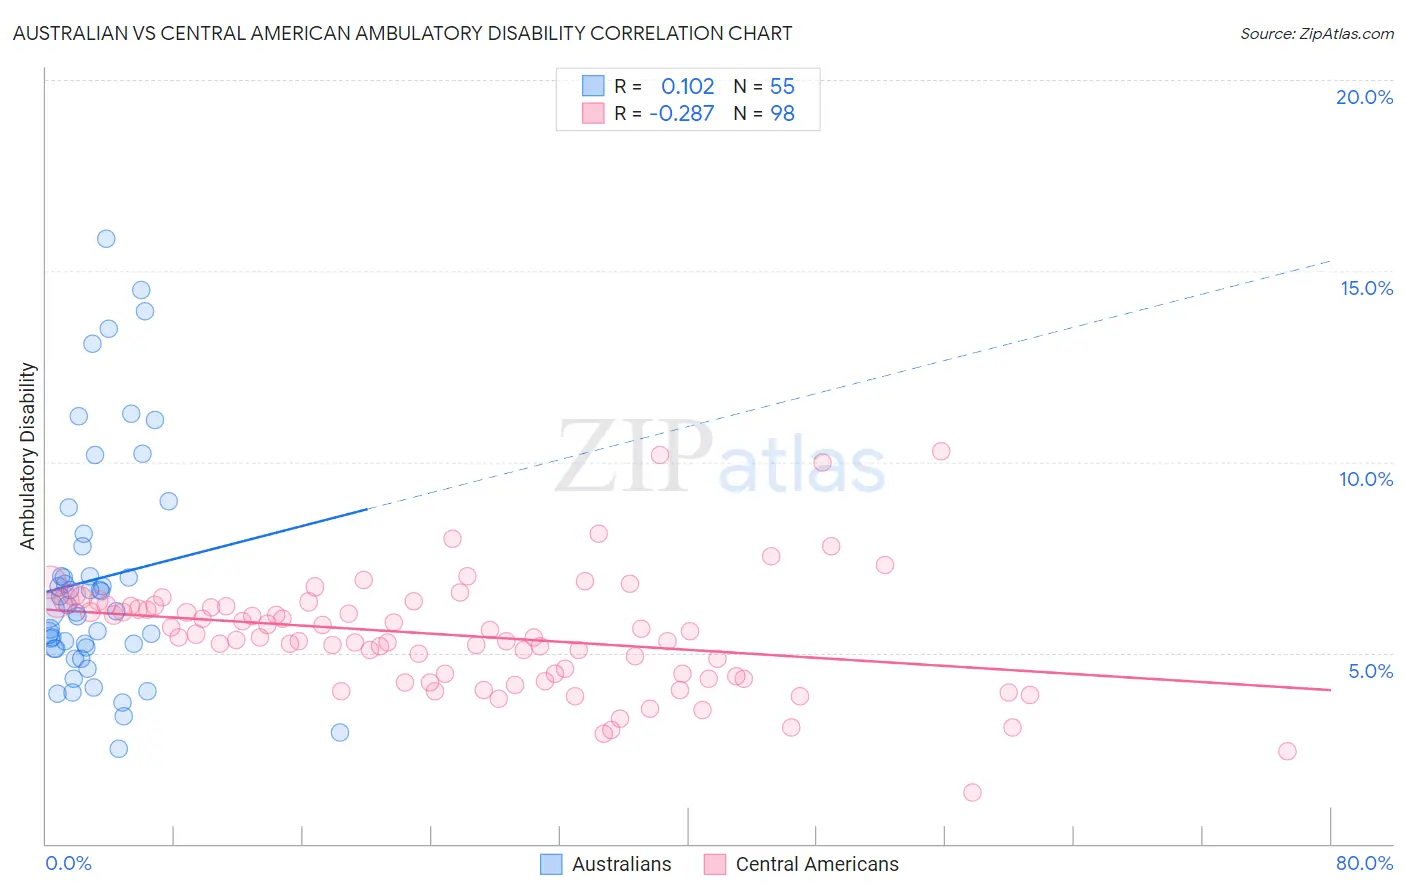
Australian vs Central American Ambulatory Disability Correlation Chart
The statistical analysis conducted on geographies consisting of 224,102,055 people shows a poor positive correlation between the proportion of Australians and percentage of population with ambulatory disability in the United States with a correlation coefficient (R) of 0.102 and weighted average of 5.8%. Similarly, the statistical analysis conducted on geographies consisting of 504,305,341 people shows a weak negative correlation between the proportion of Central Americans and percentage of population with ambulatory disability in the United States with a correlation coefficient (R) of -0.287 and weighted average of 6.0%, a difference of 5.0%.
Ambulatory Disability Correlation Summary
| Measurement | Australian | Central American |
| Minimum | 2.5% | 1.3% |
| Maximum | 15.8% | 10.3% |
| Range | 13.3% | 9.0% |
| Mean | 6.9% | 5.5% |
| Median | 6.1% | 5.4% |
| Interquartile 25% (IQ1) | 5.1% | 4.4% |
| Interquartile 75% (IQ3) | 7.8% | 6.2% |
| Interquartile Range (IQR) | 2.7% | 1.9% |
| Standard Deviation (Sample) | 3.0% | 1.5% |
| Standard Deviation (Population) | 3.0% | 1.5% |
Similar Demographics by Ambulatory Disability
Demographics Similar to Australians by Ambulatory Disability
In terms of ambulatory disability, the demographic groups most similar to Australians are Bhutanese (5.8%, a difference of 0.0%), Immigrants from Sudan (5.8%, a difference of 0.0%), Soviet Union (5.8%, a difference of 0.12%), Immigrants from Chile (5.8%, a difference of 0.16%), and Immigrants from Sierra Leone (5.8%, a difference of 0.17%).
| Demographics | Rating | Rank | Ambulatory Disability |
| Eastern Europeans | 99.2 /100 | #83 | Exceptional 5.7% |
| Ugandans | 99.2 /100 | #84 | Exceptional 5.7% |
| South Americans | 99.0 /100 | #85 | Exceptional 5.7% |
| Latvians | 99.0 /100 | #86 | Exceptional 5.7% |
| Immigrants | Chile | 98.9 /100 | #87 | Exceptional 5.8% |
| Soviet Union | 98.9 /100 | #88 | Exceptional 5.8% |
| Bhutanese | 98.8 /100 | #89 | Exceptional 5.8% |
| Australians | 98.8 /100 | #90 | Exceptional 5.8% |
| Immigrants | Sudan | 98.8 /100 | #91 | Exceptional 5.8% |
| Immigrants | Sierra Leone | 98.6 /100 | #92 | Exceptional 5.8% |
| Immigrants | Denmark | 98.6 /100 | #93 | Exceptional 5.8% |
| Kenyans | 98.4 /100 | #94 | Exceptional 5.8% |
| Immigrants | El Salvador | 98.4 /100 | #95 | Exceptional 5.8% |
| Salvadorans | 98.4 /100 | #96 | Exceptional 5.8% |
| Immigrants | Somalia | 98.3 /100 | #97 | Exceptional 5.8% |
Demographics Similar to Central Americans by Ambulatory Disability
In terms of ambulatory disability, the demographic groups most similar to Central Americans are Immigrants from Belarus (6.1%, a difference of 0.040%), Immigrants from Fiji (6.0%, a difference of 0.080%), Immigrants from Latvia (6.0%, a difference of 0.080%), Ghanaian (6.0%, a difference of 0.10%), and Northern European (6.0%, a difference of 0.13%).
| Demographics | Rating | Rank | Ambulatory Disability |
| Syrians | 75.5 /100 | #153 | Good 6.0% |
| Immigrants | Croatia | 75.1 /100 | #154 | Good 6.0% |
| Immigrants | Scotland | 72.1 /100 | #155 | Good 6.0% |
| Northern Europeans | 71.8 /100 | #156 | Good 6.0% |
| Ghanaians | 71.3 /100 | #157 | Good 6.0% |
| Immigrants | Fiji | 71.2 /100 | #158 | Good 6.0% |
| Immigrants | Latvia | 71.1 /100 | #159 | Good 6.0% |
| Central Americans | 69.8 /100 | #160 | Good 6.0% |
| Immigrants | Belarus | 69.2 /100 | #161 | Good 6.1% |
| Nigerians | 67.1 /100 | #162 | Good 6.1% |
| Lebanese | 66.2 /100 | #163 | Good 6.1% |
| Basques | 63.7 /100 | #164 | Good 6.1% |
| Nicaraguans | 63.2 /100 | #165 | Good 6.1% |
| Iraqis | 62.8 /100 | #166 | Good 6.1% |
| Immigrants | Oceania | 60.7 /100 | #167 | Good 6.1% |