Danish vs Alaskan Athabascan Ambulatory Disability
COMPARE
Danish
Alaskan Athabascan
Ambulatory Disability
Ambulatory Disability Comparison
Danes
Alaskan Athabascans
5.8%
AMBULATORY DISABILITY
96.6/ 100
METRIC RATING
111th/ 347
METRIC RANK
6.9%
AMBULATORY DISABILITY
0.0/ 100
METRIC RATING
296th/ 347
METRIC RANK
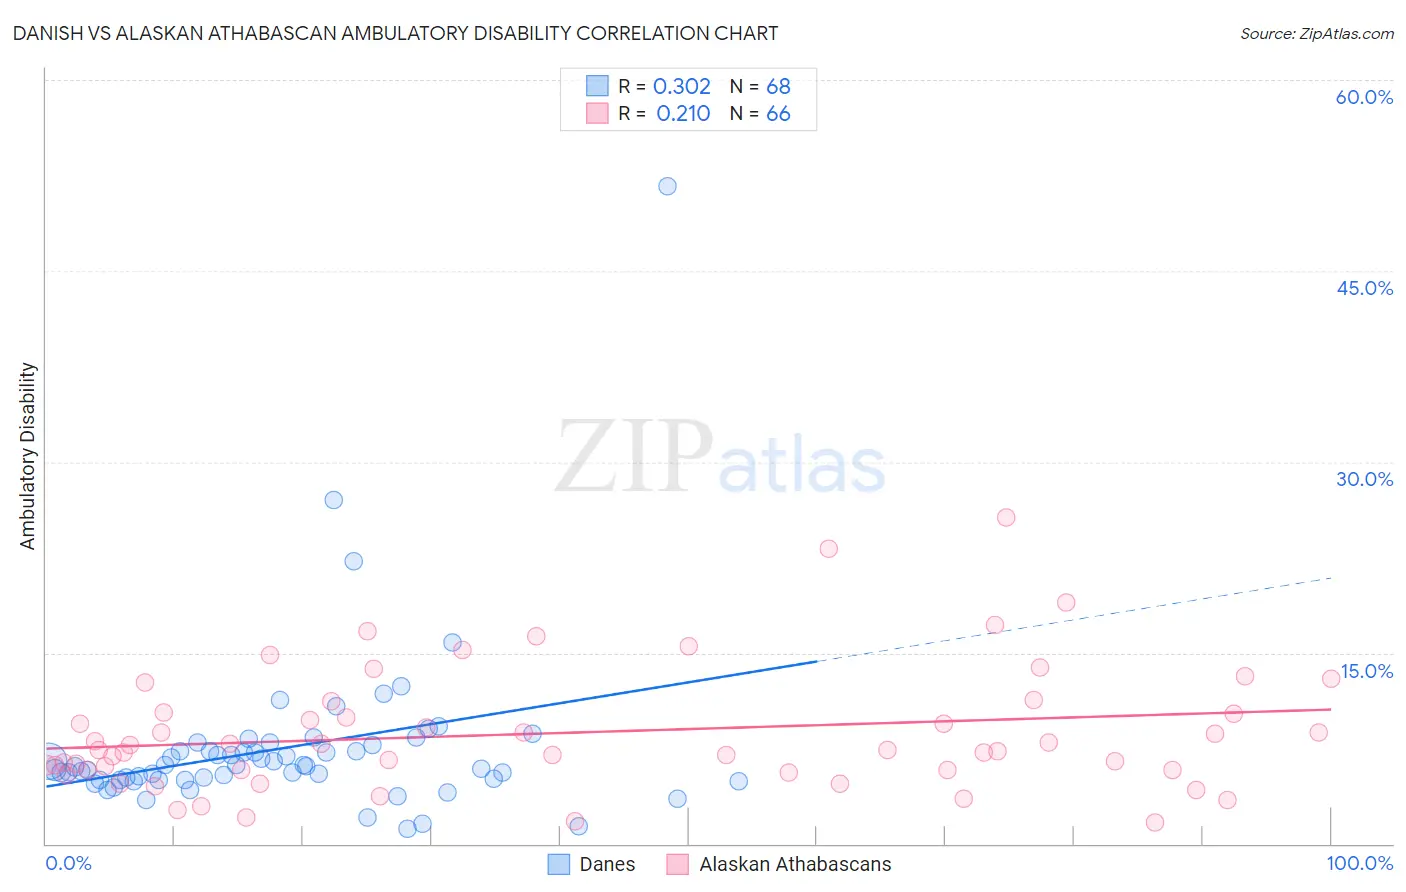
Danish vs Alaskan Athabascan Ambulatory Disability Correlation Chart
The statistical analysis conducted on geographies consisting of 473,952,893 people shows a mild positive correlation between the proportion of Danes and percentage of population with ambulatory disability in the United States with a correlation coefficient (R) of 0.302 and weighted average of 5.8%. Similarly, the statistical analysis conducted on geographies consisting of 45,819,153 people shows a weak positive correlation between the proportion of Alaskan Athabascans and percentage of population with ambulatory disability in the United States with a correlation coefficient (R) of 0.210 and weighted average of 6.9%, a difference of 18.4%.
Ambulatory Disability Correlation Summary
| Measurement | Danish | Alaskan Athabascan |
| Minimum | 1.2% | 1.7% |
| Maximum | 51.6% | 25.6% |
| Range | 50.4% | 23.9% |
| Mean | 7.5% | 8.7% |
| Median | 6.1% | 7.4% |
| Interquartile 25% (IQ1) | 5.0% | 5.8% |
| Interquartile 75% (IQ3) | 7.5% | 10.3% |
| Interquartile Range (IQR) | 2.5% | 4.5% |
| Standard Deviation (Sample) | 6.7% | 4.9% |
| Standard Deviation (Population) | 6.7% | 4.8% |
Similar Demographics by Ambulatory Disability
Demographics Similar to Danes by Ambulatory Disability
In terms of ambulatory disability, the demographic groups most similar to Danes are Immigrants from Colombia (5.8%, a difference of 0.070%), South African (5.9%, a difference of 0.13%), Immigrants from Netherlands (5.8%, a difference of 0.25%), Colombian (5.8%, a difference of 0.27%), and Uruguayan (5.8%, a difference of 0.28%).
| Demographics | Rating | Rank | Ambulatory Disability |
| New Zealanders | 97.6 /100 | #104 | Exceptional 5.8% |
| Immigrants | Czechoslovakia | 97.4 /100 | #105 | Exceptional 5.8% |
| Immigrants | Morocco | 97.3 /100 | #106 | Exceptional 5.8% |
| Uruguayans | 97.2 /100 | #107 | Exceptional 5.8% |
| Colombians | 97.2 /100 | #108 | Exceptional 5.8% |
| Immigrants | Netherlands | 97.1 /100 | #109 | Exceptional 5.8% |
| Immigrants | Colombia | 96.7 /100 | #110 | Exceptional 5.8% |
| Danes | 96.6 /100 | #111 | Exceptional 5.8% |
| South Africans | 96.3 /100 | #112 | Exceptional 5.9% |
| Immigrants | Uruguay | 95.6 /100 | #113 | Exceptional 5.9% |
| Immigrants | Poland | 95.4 /100 | #114 | Exceptional 5.9% |
| South American Indians | 94.8 /100 | #115 | Exceptional 5.9% |
| Immigrants | Africa | 94.7 /100 | #116 | Exceptional 5.9% |
| Immigrants | South Eastern Asia | 93.6 /100 | #117 | Exceptional 5.9% |
| Russians | 93.4 /100 | #118 | Exceptional 5.9% |
Demographics Similar to Alaskan Athabascans by Ambulatory Disability
In terms of ambulatory disability, the demographic groups most similar to Alaskan Athabascans are French American Indian (6.9%, a difference of 0.17%), Immigrants from Grenada (6.9%, a difference of 0.18%), Crow (6.9%, a difference of 0.23%), Cape Verdean (6.9%, a difference of 0.30%), and Puget Sound Salish (6.9%, a difference of 0.31%).
| Demographics | Rating | Rank | Ambulatory Disability |
| Immigrants | Dominica | 0.0 /100 | #289 | Tragic 6.9% |
| Scotch-Irish | 0.0 /100 | #290 | Tragic 6.9% |
| West Indians | 0.0 /100 | #291 | Tragic 6.9% |
| Cheyenne | 0.0 /100 | #292 | Tragic 6.9% |
| Immigrants | St. Vincent and the Grenadines | 0.0 /100 | #293 | Tragic 6.9% |
| Cape Verdeans | 0.0 /100 | #294 | Tragic 6.9% |
| Crow | 0.0 /100 | #295 | Tragic 6.9% |
| Alaskan Athabascans | 0.0 /100 | #296 | Tragic 6.9% |
| French American Indians | 0.0 /100 | #297 | Tragic 6.9% |
| Immigrants | Grenada | 0.0 /100 | #298 | Tragic 6.9% |
| Puget Sound Salish | 0.0 /100 | #299 | Tragic 6.9% |
| Marshallese | 0.0 /100 | #300 | Tragic 6.9% |
| British West Indians | 0.0 /100 | #301 | Tragic 7.0% |
| Immigrants | Armenia | 0.0 /100 | #302 | Tragic 7.0% |
| Africans | 0.0 /100 | #303 | Tragic 7.0% |