Danish vs Central American College, Under 1 year
COMPARE
Danish
Central American
College, Under 1 year
College, Under 1 year Comparison
Danes
Central Americans
68.5%
COLLEGE, UNDER 1 YEAR
98.6/ 100
METRIC RATING
78th/ 347
METRIC RANK
57.7%
COLLEGE, UNDER 1 YEAR
0.0/ 100
METRIC RATING
308th/ 347
METRIC RANK
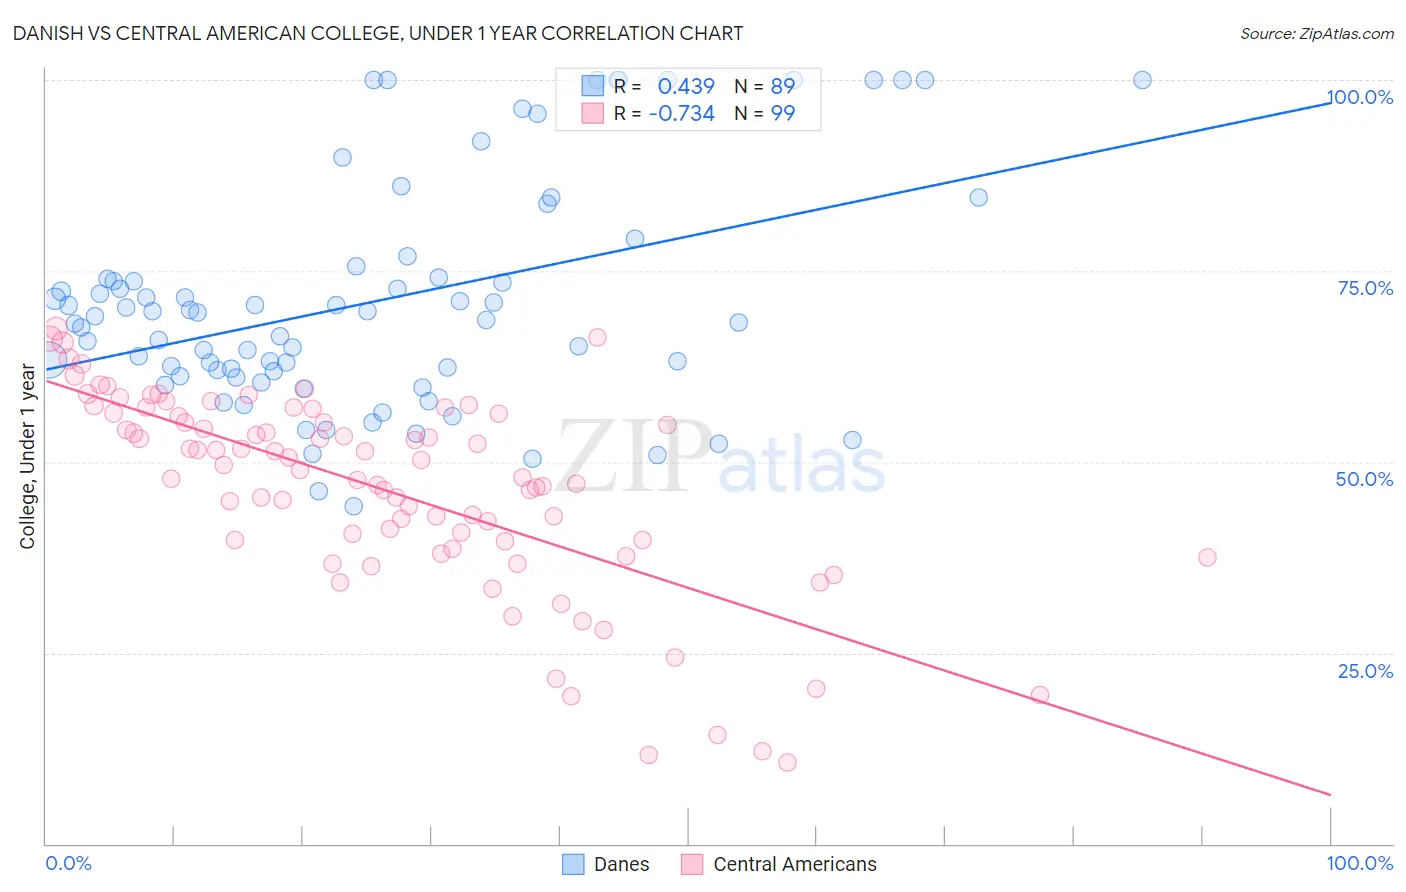
Danish vs Central American College, Under 1 year Correlation Chart
The statistical analysis conducted on geographies consisting of 474,193,485 people shows a moderate positive correlation between the proportion of Danes and percentage of population with at least college, under 1 year education in the United States with a correlation coefficient (R) of 0.439 and weighted average of 68.5%. Similarly, the statistical analysis conducted on geographies consisting of 504,615,987 people shows a strong negative correlation between the proportion of Central Americans and percentage of population with at least college, under 1 year education in the United States with a correlation coefficient (R) of -0.734 and weighted average of 57.7%, a difference of 18.7%.
College, Under 1 year Correlation Summary
| Measurement | Danish | Central American |
| Minimum | 44.2% | 10.7% |
| Maximum | 100.0% | 67.5% |
| Range | 55.8% | 56.8% |
| Mean | 71.0% | 46.4% |
| Median | 69.1% | 48.9% |
| Interquartile 25% (IQ1) | 61.5% | 39.6% |
| Interquartile 75% (IQ3) | 74.9% | 56.3% |
| Interquartile Range (IQR) | 13.4% | 16.7% |
| Standard Deviation (Sample) | 14.8% | 13.0% |
| Standard Deviation (Population) | 14.7% | 12.9% |
Similar Demographics by College, Under 1 year
Demographics Similar to Danes by College, Under 1 year
In terms of college, under 1 year, the demographic groups most similar to Danes are British (68.5%, a difference of 0.010%), Greek (68.5%, a difference of 0.010%), Immigrants from Spain (68.4%, a difference of 0.040%), Laotian (68.5%, a difference of 0.050%), and Immigrants from Western Europe (68.5%, a difference of 0.060%).
| Demographics | Rating | Rank | College, Under 1 year |
| Immigrants | Europe | 99.1 /100 | #71 | Exceptional 68.8% |
| Bolivians | 99.0 /100 | #72 | Exceptional 68.7% |
| Immigrants | England | 99.0 /100 | #73 | Exceptional 68.7% |
| Swedes | 98.9 /100 | #74 | Exceptional 68.7% |
| Immigrants | Western Europe | 98.6 /100 | #75 | Exceptional 68.5% |
| Laotians | 98.6 /100 | #76 | Exceptional 68.5% |
| British | 98.6 /100 | #77 | Exceptional 68.5% |
| Danes | 98.6 /100 | #78 | Exceptional 68.5% |
| Greeks | 98.6 /100 | #79 | Exceptional 68.5% |
| Immigrants | Spain | 98.5 /100 | #80 | Exceptional 68.4% |
| Immigrants | Greece | 98.5 /100 | #81 | Exceptional 68.4% |
| Norwegians | 98.4 /100 | #82 | Exceptional 68.4% |
| Argentineans | 98.4 /100 | #83 | Exceptional 68.4% |
| Immigrants | Hungary | 98.3 /100 | #84 | Exceptional 68.3% |
| Egyptians | 98.3 /100 | #85 | Exceptional 68.3% |
Demographics Similar to Central Americans by College, Under 1 year
In terms of college, under 1 year, the demographic groups most similar to Central Americans are Fijian (57.7%, a difference of 0.0%), Immigrants from Portugal (57.7%, a difference of 0.010%), Immigrants from Nicaragua (57.6%, a difference of 0.12%), Haitian (57.8%, a difference of 0.21%), and Kiowa (57.8%, a difference of 0.32%).
| Demographics | Rating | Rank | College, Under 1 year |
| Mexican American Indians | 0.0 /100 | #301 | Tragic 58.1% |
| Apache | 0.0 /100 | #302 | Tragic 58.0% |
| Immigrants | Dominica | 0.0 /100 | #303 | Tragic 57.9% |
| Kiowa | 0.0 /100 | #304 | Tragic 57.8% |
| Haitians | 0.0 /100 | #305 | Tragic 57.8% |
| Immigrants | Portugal | 0.0 /100 | #306 | Tragic 57.7% |
| Fijians | 0.0 /100 | #307 | Tragic 57.7% |
| Central Americans | 0.0 /100 | #308 | Tragic 57.7% |
| Immigrants | Nicaragua | 0.0 /100 | #309 | Tragic 57.6% |
| Pueblo | 0.0 /100 | #310 | Tragic 57.4% |
| Cajuns | 0.0 /100 | #311 | Tragic 57.3% |
| Salvadorans | 0.0 /100 | #312 | Tragic 57.3% |
| Dutch West Indians | 0.0 /100 | #313 | Tragic 57.2% |
| Hopi | 0.0 /100 | #314 | Tragic 57.1% |
| Hondurans | 0.0 /100 | #315 | Tragic 57.1% |