Danish vs Immigrants from Iraq Ambulatory Disability
COMPARE
Danish
Immigrants from Iraq
Ambulatory Disability
Ambulatory Disability Comparison
Danes
Immigrants from Iraq
5.8%
AMBULATORY DISABILITY
96.6/ 100
METRIC RATING
111th/ 347
METRIC RANK
6.3%
AMBULATORY DISABILITY
14.0/ 100
METRIC RATING
209th/ 347
METRIC RANK
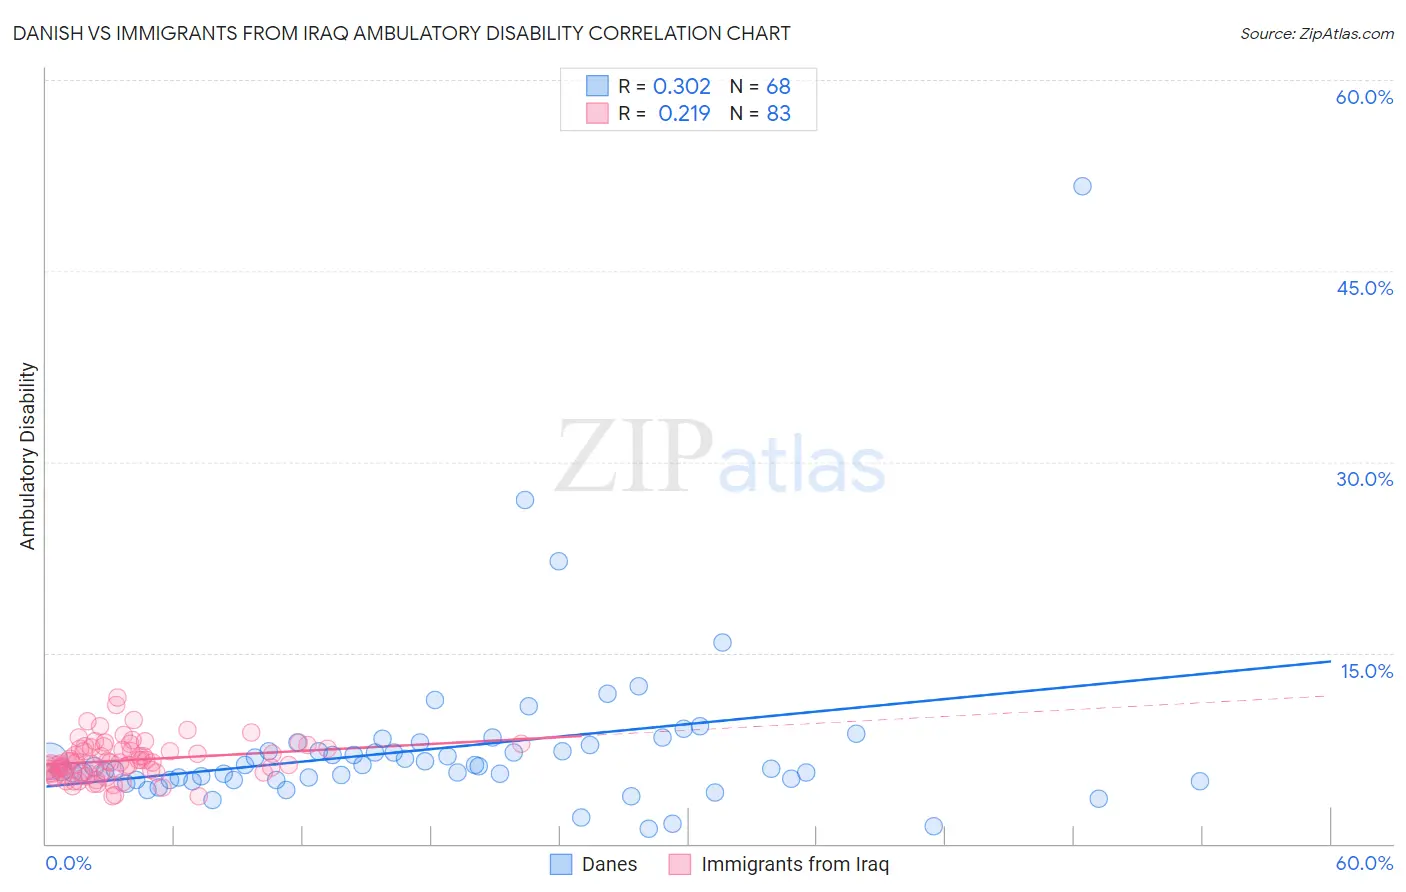
Danish vs Immigrants from Iraq Ambulatory Disability Correlation Chart
The statistical analysis conducted on geographies consisting of 473,952,893 people shows a mild positive correlation between the proportion of Danes and percentage of population with ambulatory disability in the United States with a correlation coefficient (R) of 0.302 and weighted average of 5.8%. Similarly, the statistical analysis conducted on geographies consisting of 194,765,362 people shows a weak positive correlation between the proportion of Immigrants from Iraq and percentage of population with ambulatory disability in the United States with a correlation coefficient (R) of 0.219 and weighted average of 6.3%, a difference of 7.1%.
Ambulatory Disability Correlation Summary
| Measurement | Danish | Immigrants from Iraq |
| Minimum | 1.2% | 3.7% |
| Maximum | 51.6% | 11.5% |
| Range | 50.4% | 7.8% |
| Mean | 7.5% | 6.6% |
| Median | 6.1% | 6.4% |
| Interquartile 25% (IQ1) | 5.0% | 5.6% |
| Interquartile 75% (IQ3) | 7.5% | 7.4% |
| Interquartile Range (IQR) | 2.5% | 1.9% |
| Standard Deviation (Sample) | 6.7% | 1.5% |
| Standard Deviation (Population) | 6.7% | 1.5% |
Similar Demographics by Ambulatory Disability
Demographics Similar to Danes by Ambulatory Disability
In terms of ambulatory disability, the demographic groups most similar to Danes are Immigrants from Colombia (5.8%, a difference of 0.070%), South African (5.9%, a difference of 0.13%), Immigrants from Netherlands (5.8%, a difference of 0.25%), Colombian (5.8%, a difference of 0.27%), and Uruguayan (5.8%, a difference of 0.28%).
| Demographics | Rating | Rank | Ambulatory Disability |
| New Zealanders | 97.6 /100 | #104 | Exceptional 5.8% |
| Immigrants | Czechoslovakia | 97.4 /100 | #105 | Exceptional 5.8% |
| Immigrants | Morocco | 97.3 /100 | #106 | Exceptional 5.8% |
| Uruguayans | 97.2 /100 | #107 | Exceptional 5.8% |
| Colombians | 97.2 /100 | #108 | Exceptional 5.8% |
| Immigrants | Netherlands | 97.1 /100 | #109 | Exceptional 5.8% |
| Immigrants | Colombia | 96.7 /100 | #110 | Exceptional 5.8% |
| Danes | 96.6 /100 | #111 | Exceptional 5.8% |
| South Africans | 96.3 /100 | #112 | Exceptional 5.9% |
| Immigrants | Uruguay | 95.6 /100 | #113 | Exceptional 5.9% |
| Immigrants | Poland | 95.4 /100 | #114 | Exceptional 5.9% |
| South American Indians | 94.8 /100 | #115 | Exceptional 5.9% |
| Immigrants | Africa | 94.7 /100 | #116 | Exceptional 5.9% |
| Immigrants | South Eastern Asia | 93.6 /100 | #117 | Exceptional 5.9% |
| Russians | 93.4 /100 | #118 | Exceptional 5.9% |
Demographics Similar to Immigrants from Iraq by Ambulatory Disability
In terms of ambulatory disability, the demographic groups most similar to Immigrants from Iraq are Bangladeshi (6.3%, a difference of 0.020%), Immigrants from Laos (6.3%, a difference of 0.080%), Alsatian (6.3%, a difference of 0.11%), Samoan (6.3%, a difference of 0.22%), and Mexican American Indian (6.3%, a difference of 0.23%).
| Demographics | Rating | Rank | Ambulatory Disability |
| Albanians | 19.7 /100 | #202 | Poor 6.2% |
| Immigrants | Ukraine | 18.4 /100 | #203 | Poor 6.2% |
| Immigrants | Congo | 18.2 /100 | #204 | Poor 6.2% |
| Slovenes | 18.0 /100 | #205 | Poor 6.2% |
| Finns | 17.2 /100 | #206 | Poor 6.2% |
| Alsatians | 15.1 /100 | #207 | Poor 6.3% |
| Bangladeshis | 14.2 /100 | #208 | Poor 6.3% |
| Immigrants | Iraq | 14.0 /100 | #209 | Poor 6.3% |
| Immigrants | Laos | 13.2 /100 | #210 | Poor 6.3% |
| Samoans | 12.1 /100 | #211 | Poor 6.3% |
| Mexican American Indians | 12.0 /100 | #212 | Poor 6.3% |
| Japanese | 12.0 /100 | #213 | Poor 6.3% |
| Immigrants | Mexico | 11.0 /100 | #214 | Poor 6.3% |
| Immigrants | Latin America | 11.0 /100 | #215 | Poor 6.3% |
| Canadians | 10.9 /100 | #216 | Poor 6.3% |