Fijian vs Central American Ambulatory Disability
COMPARE
Fijian
Central American
Ambulatory Disability
Ambulatory Disability Comparison
Fijians
Central Americans
6.8%
AMBULATORY DISABILITY
0.0/ 100
METRIC RATING
285th/ 347
METRIC RANK
6.0%
AMBULATORY DISABILITY
69.8/ 100
METRIC RATING
160th/ 347
METRIC RANK
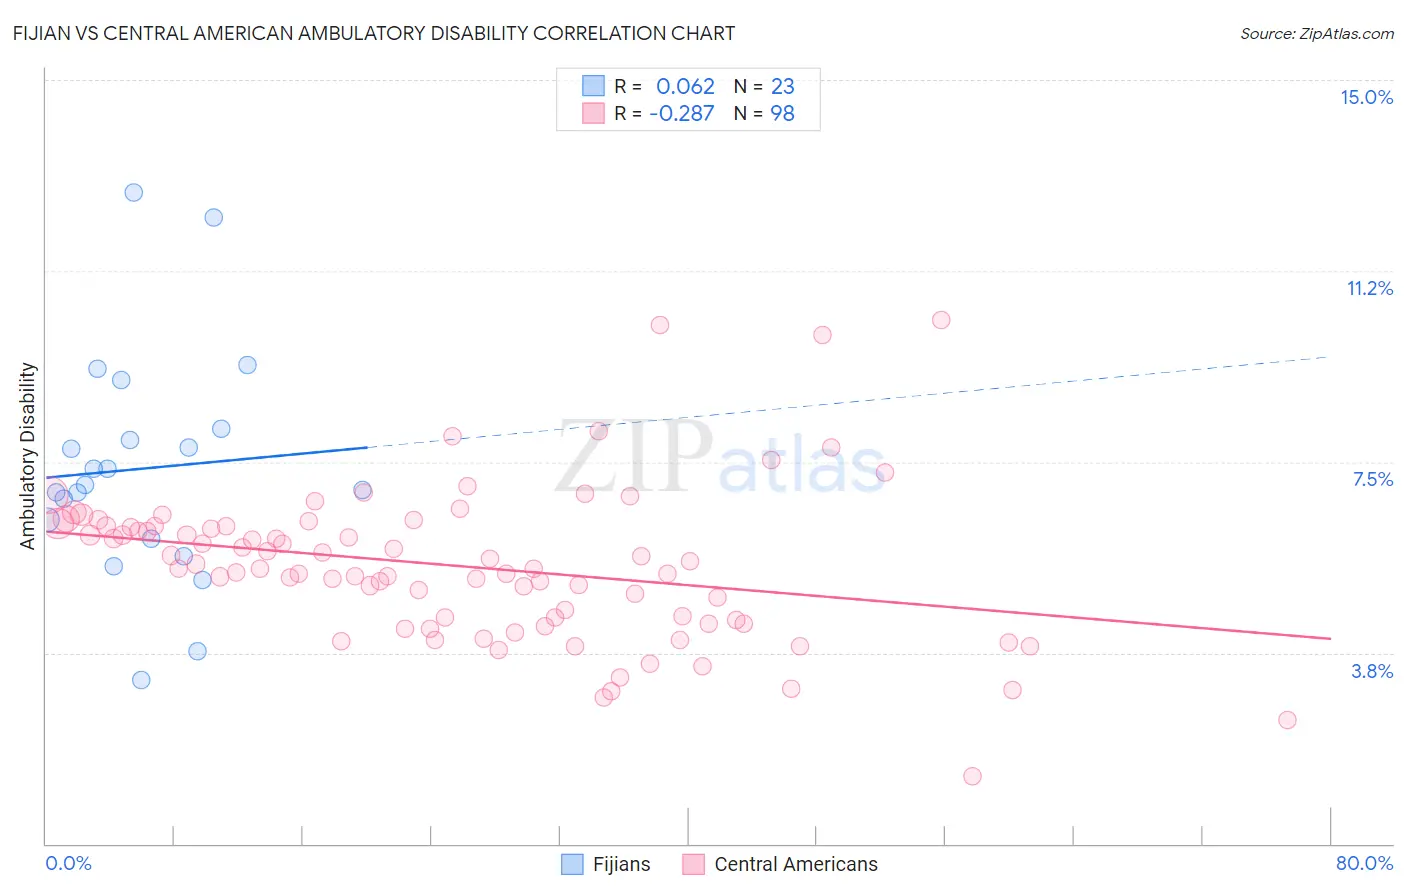
Fijian vs Central American Ambulatory Disability Correlation Chart
The statistical analysis conducted on geographies consisting of 55,947,275 people shows a slight positive correlation between the proportion of Fijians and percentage of population with ambulatory disability in the United States with a correlation coefficient (R) of 0.062 and weighted average of 6.8%. Similarly, the statistical analysis conducted on geographies consisting of 504,305,341 people shows a weak negative correlation between the proportion of Central Americans and percentage of population with ambulatory disability in the United States with a correlation coefficient (R) of -0.287 and weighted average of 6.0%, a difference of 12.5%.
Ambulatory Disability Correlation Summary
| Measurement | Fijian | Central American |
| Minimum | 3.2% | 1.3% |
| Maximum | 12.8% | 10.3% |
| Range | 9.6% | 9.0% |
| Mean | 7.4% | 5.5% |
| Median | 7.1% | 5.4% |
| Interquartile 25% (IQ1) | 6.0% | 4.4% |
| Interquartile 75% (IQ3) | 8.2% | 6.2% |
| Interquartile Range (IQR) | 2.2% | 1.9% |
| Standard Deviation (Sample) | 2.3% | 1.5% |
| Standard Deviation (Population) | 2.2% | 1.5% |
Similar Demographics by Ambulatory Disability
Demographics Similar to Fijians by Ambulatory Disability
In terms of ambulatory disability, the demographic groups most similar to Fijians are Yakama (6.8%, a difference of 0.040%), U.S. Virgin Islander (6.8%, a difference of 0.36%), Immigrants from Jamaica (6.8%, a difference of 0.41%), Immigrants from Barbados (6.8%, a difference of 0.48%), and Barbadian (6.8%, a difference of 0.64%).
| Demographics | Rating | Rank | Ambulatory Disability |
| Immigrants | West Indies | 0.1 /100 | #278 | Tragic 6.7% |
| Immigrants | Caribbean | 0.0 /100 | #279 | Tragic 6.7% |
| Pennsylvania Germans | 0.0 /100 | #280 | Tragic 6.8% |
| Yaqui | 0.0 /100 | #281 | Tragic 6.8% |
| Barbadians | 0.0 /100 | #282 | Tragic 6.8% |
| Immigrants | Barbados | 0.0 /100 | #283 | Tragic 6.8% |
| Immigrants | Jamaica | 0.0 /100 | #284 | Tragic 6.8% |
| Fijians | 0.0 /100 | #285 | Tragic 6.8% |
| Yakama | 0.0 /100 | #286 | Tragic 6.8% |
| U.S. Virgin Islanders | 0.0 /100 | #287 | Tragic 6.8% |
| Immigrants | Nonimmigrants | 0.0 /100 | #288 | Tragic 6.9% |
| Immigrants | Dominica | 0.0 /100 | #289 | Tragic 6.9% |
| Scotch-Irish | 0.0 /100 | #290 | Tragic 6.9% |
| West Indians | 0.0 /100 | #291 | Tragic 6.9% |
| Cheyenne | 0.0 /100 | #292 | Tragic 6.9% |
Demographics Similar to Central Americans by Ambulatory Disability
In terms of ambulatory disability, the demographic groups most similar to Central Americans are Immigrants from Belarus (6.1%, a difference of 0.040%), Immigrants from Fiji (6.0%, a difference of 0.080%), Immigrants from Latvia (6.0%, a difference of 0.080%), Ghanaian (6.0%, a difference of 0.10%), and Northern European (6.0%, a difference of 0.13%).
| Demographics | Rating | Rank | Ambulatory Disability |
| Syrians | 75.5 /100 | #153 | Good 6.0% |
| Immigrants | Croatia | 75.1 /100 | #154 | Good 6.0% |
| Immigrants | Scotland | 72.1 /100 | #155 | Good 6.0% |
| Northern Europeans | 71.8 /100 | #156 | Good 6.0% |
| Ghanaians | 71.3 /100 | #157 | Good 6.0% |
| Immigrants | Fiji | 71.2 /100 | #158 | Good 6.0% |
| Immigrants | Latvia | 71.1 /100 | #159 | Good 6.0% |
| Central Americans | 69.8 /100 | #160 | Good 6.0% |
| Immigrants | Belarus | 69.2 /100 | #161 | Good 6.1% |
| Nigerians | 67.1 /100 | #162 | Good 6.1% |
| Lebanese | 66.2 /100 | #163 | Good 6.1% |
| Basques | 63.7 /100 | #164 | Good 6.1% |
| Nicaraguans | 63.2 /100 | #165 | Good 6.1% |
| Iraqis | 62.8 /100 | #166 | Good 6.1% |
| Immigrants | Oceania | 60.7 /100 | #167 | Good 6.1% |