Danish vs Central American Average Family Size
COMPARE
Danish
Central American
Average Family Size
Average Family Size Comparison
Danes
Central Americans
3.17
AVERAGE FAMILY SIZE
2.5/ 100
METRIC RATING
246th/ 347
METRIC RANK
3.41
AVERAGE FAMILY SIZE
100.0/ 100
METRIC RATING
31st/ 347
METRIC RANK
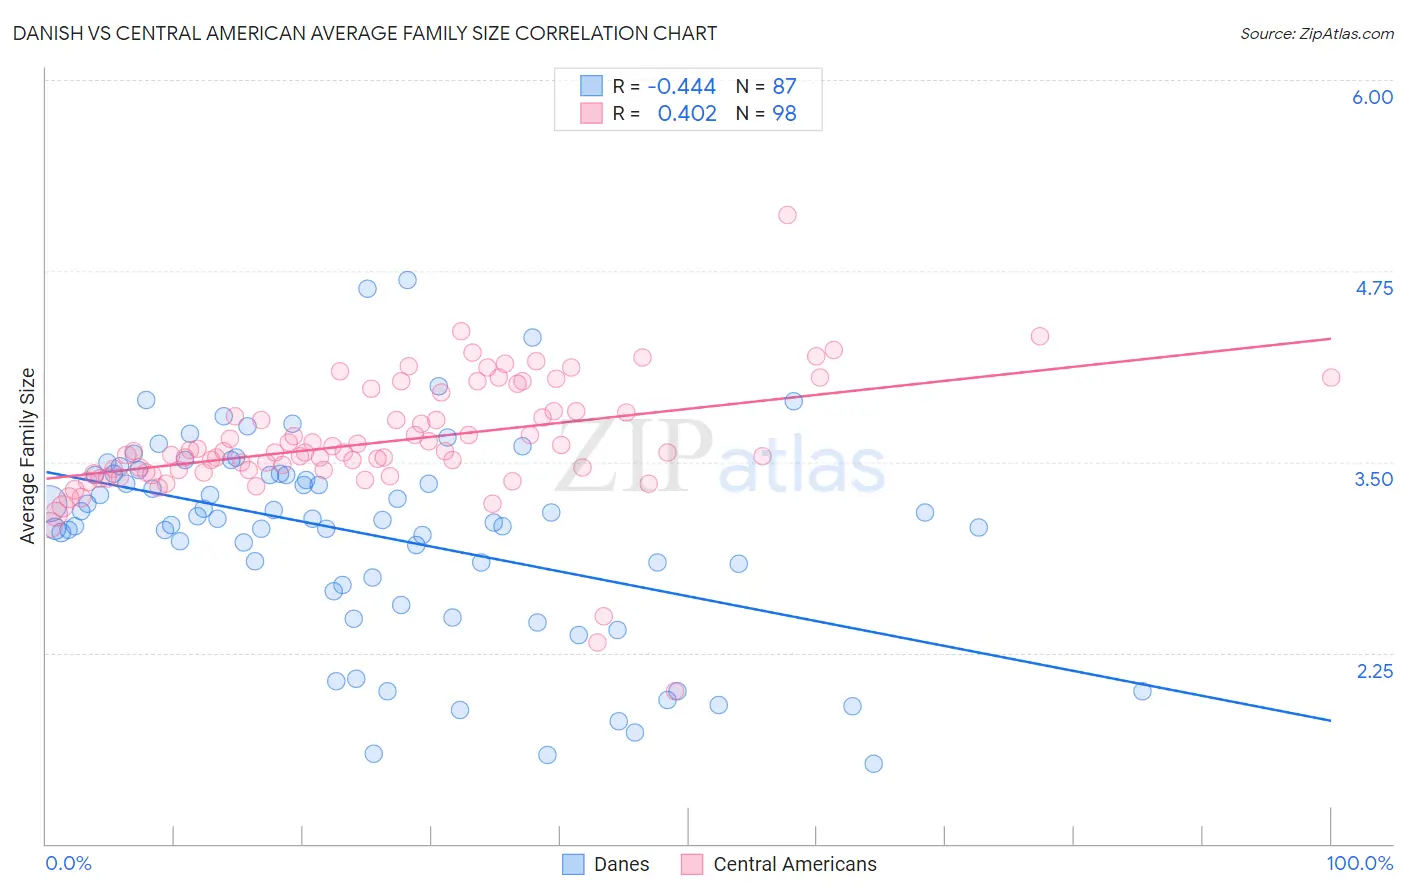
Danish vs Central American Average Family Size Correlation Chart
The statistical analysis conducted on geographies consisting of 473,910,461 people shows a moderate negative correlation between the proportion of Danes and average family size in the United States with a correlation coefficient (R) of -0.444 and weighted average of 3.17. Similarly, the statistical analysis conducted on geographies consisting of 504,084,527 people shows a moderate positive correlation between the proportion of Central Americans and average family size in the United States with a correlation coefficient (R) of 0.402 and weighted average of 3.41, a difference of 7.5%.
Average Family Size Correlation Summary
| Measurement | Danish | Central American |
| Minimum | 1.52 | 2.00 |
| Maximum | 4.69 | 5.12 |
| Range | 3.17 | 3.12 |
| Mean | 3.03 | 3.63 |
| Median | 3.12 | 3.56 |
| Interquartile 25% (IQ1) | 2.69 | 3.43 |
| Interquartile 75% (IQ3) | 3.42 | 3.83 |
| Interquartile Range (IQR) | 0.73 | 0.40 |
| Standard Deviation (Sample) | 0.67 | 0.41 |
| Standard Deviation (Population) | 0.66 | 0.40 |
Similar Demographics by Average Family Size
Demographics Similar to Danes by Average Family Size
In terms of average family size, the demographic groups most similar to Danes are Cajun (3.17, a difference of 0.010%), Immigrants from Brazil (3.18, a difference of 0.040%), Immigrants from Belarus (3.17, a difference of 0.040%), Immigrants from Southern Europe (3.18, a difference of 0.070%), and Hungarian (3.18, a difference of 0.080%).
| Demographics | Rating | Rank | Average Family Size |
| Houma | 3.4 /100 | #239 | Tragic 3.18 |
| Osage | 3.2 /100 | #240 | Tragic 3.18 |
| Immigrants | Japan | 3.0 /100 | #241 | Tragic 3.18 |
| Hungarians | 3.0 /100 | #242 | Tragic 3.18 |
| Immigrants | Moldova | 2.9 /100 | #243 | Tragic 3.18 |
| Immigrants | Southern Europe | 2.9 /100 | #244 | Tragic 3.18 |
| Immigrants | Brazil | 2.7 /100 | #245 | Tragic 3.18 |
| Danes | 2.5 /100 | #246 | Tragic 3.17 |
| Cajuns | 2.4 /100 | #247 | Tragic 3.17 |
| Immigrants | Belarus | 2.3 /100 | #248 | Tragic 3.17 |
| Immigrants | Eastern Europe | 2.1 /100 | #249 | Tragic 3.17 |
| Puget Sound Salish | 1.9 /100 | #250 | Tragic 3.17 |
| Immigrants | Spain | 1.8 /100 | #251 | Tragic 3.17 |
| Immigrants | Saudi Arabia | 1.7 /100 | #252 | Tragic 3.17 |
| South Africans | 1.7 /100 | #253 | Tragic 3.17 |
Demographics Similar to Central Americans by Average Family Size
In terms of average family size, the demographic groups most similar to Central Americans are Immigrants from Guatemala (3.41, a difference of 0.10%), Hawaiian (3.41, a difference of 0.12%), Hispanic or Latino (3.41, a difference of 0.18%), Samoan (3.42, a difference of 0.20%), and Nepalese (3.42, a difference of 0.23%).
| Demographics | Rating | Rank | Average Family Size |
| Natives/Alaskans | 100.0 /100 | #24 | Exceptional 3.45 |
| Yakama | 100.0 /100 | #25 | Exceptional 3.45 |
| Native Hawaiians | 100.0 /100 | #26 | Exceptional 3.43 |
| Mexican American Indians | 100.0 /100 | #27 | Exceptional 3.43 |
| Immigrants | Latin America | 100.0 /100 | #28 | Exceptional 3.42 |
| Nepalese | 100.0 /100 | #29 | Exceptional 3.42 |
| Samoans | 100.0 /100 | #30 | Exceptional 3.42 |
| Central Americans | 100.0 /100 | #31 | Exceptional 3.41 |
| Immigrants | Guatemala | 100.0 /100 | #32 | Exceptional 3.41 |
| Hawaiians | 100.0 /100 | #33 | Exceptional 3.41 |
| Hispanics or Latinos | 100.0 /100 | #34 | Exceptional 3.41 |
| Guatemalans | 100.0 /100 | #35 | Exceptional 3.40 |
| Immigrants | Guyana | 100.0 /100 | #36 | Exceptional 3.40 |
| Guyanese | 100.0 /100 | #37 | Exceptional 3.40 |
| Immigrants | Belize | 100.0 /100 | #38 | Exceptional 3.39 |