Croatian vs Latvian Seniors Poverty Over the Age of 75
COMPARE
Croatian
Latvian
Seniors Poverty Over the Age of 75
Seniors Poverty Over the Age of 75 Comparison
Croatians
Latvians
10.5%
SENIORS POVERTY OVER THE AGE OF 75
99.9/ 100
METRIC RATING
13th/ 347
METRIC RANK
10.8%
SENIORS POVERTY OVER THE AGE OF 75
99.6/ 100
METRIC RATING
37th/ 347
METRIC RANK
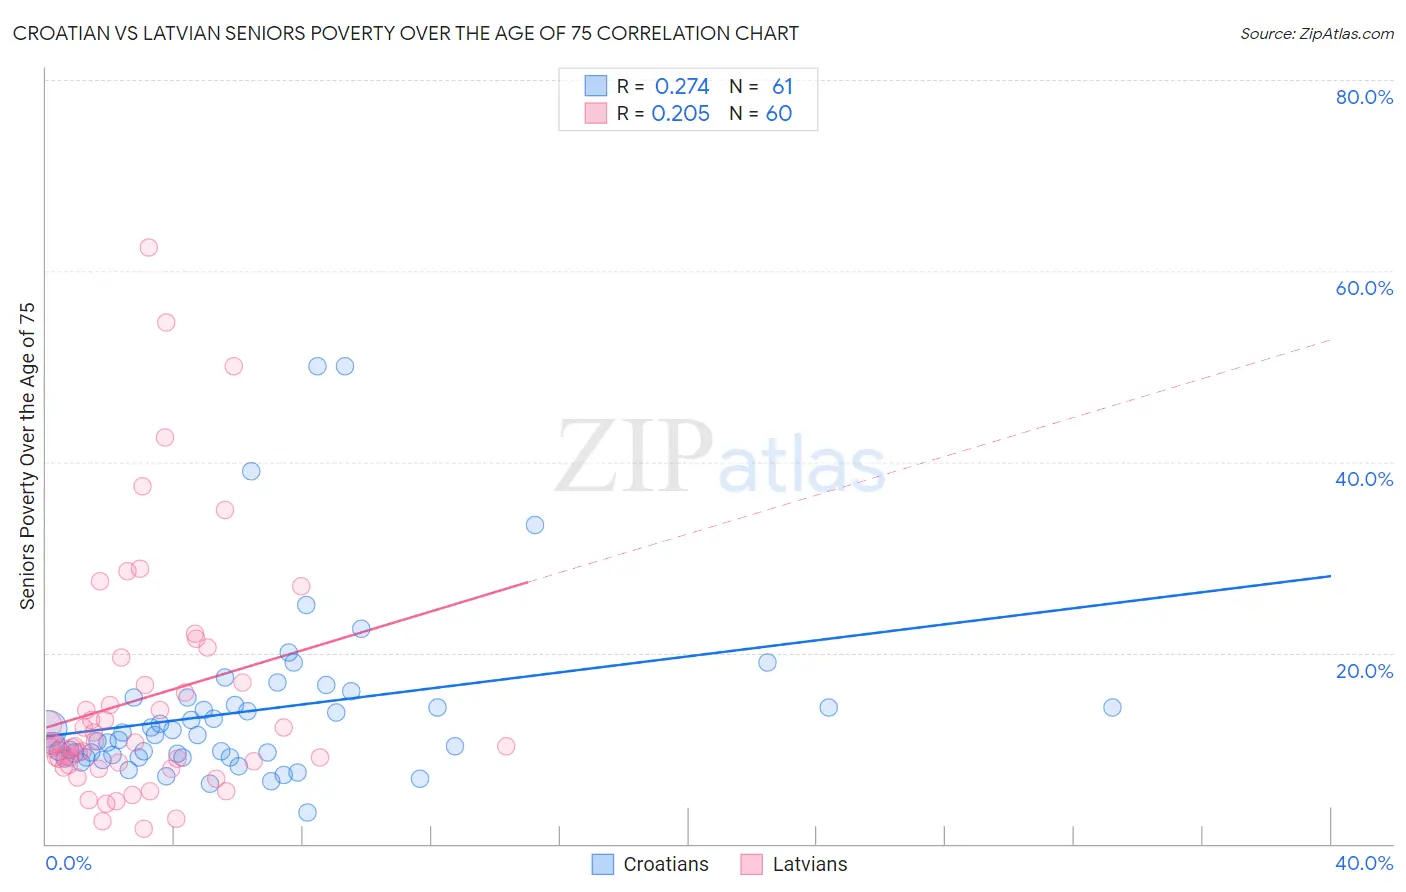
Croatian vs Latvian Seniors Poverty Over the Age of 75 Correlation Chart
The statistical analysis conducted on geographies consisting of 371,524,992 people shows a weak positive correlation between the proportion of Croatians and poverty level among seniors over the age of 75 in the United States with a correlation coefficient (R) of 0.274 and weighted average of 10.5%. Similarly, the statistical analysis conducted on geographies consisting of 219,227,834 people shows a weak positive correlation between the proportion of Latvians and poverty level among seniors over the age of 75 in the United States with a correlation coefficient (R) of 0.205 and weighted average of 10.8%, a difference of 3.1%.
Seniors Poverty Over the Age of 75 Correlation Summary
| Measurement | Croatian | Latvian |
| Minimum | 3.2% | 1.5% |
| Maximum | 50.0% | 62.5% |
| Range | 46.8% | 61.0% |
| Mean | 13.9% | 15.1% |
| Median | 11.3% | 10.4% |
| Interquartile 25% (IQ1) | 9.1% | 8.4% |
| Interquartile 75% (IQ3) | 14.9% | 16.8% |
| Interquartile Range (IQR) | 5.8% | 8.4% |
| Standard Deviation (Sample) | 9.0% | 12.7% |
| Standard Deviation (Population) | 8.9% | 12.6% |
Similar Demographics by Seniors Poverty Over the Age of 75
Demographics Similar to Croatians by Seniors Poverty Over the Age of 75
In terms of seniors poverty over the age of 75, the demographic groups most similar to Croatians are Tongan (10.5%, a difference of 0.10%), Scottish (10.5%, a difference of 0.15%), European (10.5%, a difference of 0.15%), Dutch (10.5%, a difference of 0.27%), and Immigrants from India (10.4%, a difference of 0.46%).
| Demographics | Rating | Rank | Seniors Poverty Over the Age of 75 |
| Danes | 100.0 /100 | #6 | Exceptional 10.2% |
| Maltese | 100.0 /100 | #7 | Exceptional 10.3% |
| Germans | 99.9 /100 | #8 | Exceptional 10.4% |
| English | 99.9 /100 | #9 | Exceptional 10.4% |
| Scandinavians | 99.9 /100 | #10 | Exceptional 10.4% |
| Immigrants | India | 99.9 /100 | #11 | Exceptional 10.4% |
| Tongans | 99.9 /100 | #12 | Exceptional 10.5% |
| Croatians | 99.9 /100 | #13 | Exceptional 10.5% |
| Scottish | 99.9 /100 | #14 | Exceptional 10.5% |
| Europeans | 99.9 /100 | #15 | Exceptional 10.5% |
| Dutch | 99.9 /100 | #16 | Exceptional 10.5% |
| Slovaks | 99.9 /100 | #17 | Exceptional 10.5% |
| Welsh | 99.9 /100 | #18 | Exceptional 10.5% |
| Immigrants | Scotland | 99.9 /100 | #19 | Exceptional 10.5% |
| Czechs | 99.9 /100 | #20 | Exceptional 10.5% |
Demographics Similar to Latvians by Seniors Poverty Over the Age of 75
In terms of seniors poverty over the age of 75, the demographic groups most similar to Latvians are Finnish (10.8%, a difference of 0.14%), Scotch-Irish (10.8%, a difference of 0.16%), Luxembourger (10.8%, a difference of 0.21%), Italian (10.8%, a difference of 0.60%), and Puget Sound Salish (10.8%, a difference of 0.65%).
| Demographics | Rating | Rank | Seniors Poverty Over the Age of 75 |
| Swiss | 99.7 /100 | #30 | Exceptional 10.7% |
| Marshallese | 99.7 /100 | #31 | Exceptional 10.7% |
| British | 99.7 /100 | #32 | Exceptional 10.7% |
| Puget Sound Salish | 99.7 /100 | #33 | Exceptional 10.8% |
| Italians | 99.7 /100 | #34 | Exceptional 10.8% |
| Luxembourgers | 99.6 /100 | #35 | Exceptional 10.8% |
| Scotch-Irish | 99.6 /100 | #36 | Exceptional 10.8% |
| Latvians | 99.6 /100 | #37 | Exceptional 10.8% |
| Finns | 99.6 /100 | #38 | Exceptional 10.8% |
| Czechoslovakians | 99.4 /100 | #39 | Exceptional 10.9% |
| Thais | 99.4 /100 | #40 | Exceptional 10.9% |
| Immigrants | Lithuania | 99.2 /100 | #41 | Exceptional 11.0% |
| Austrians | 99.1 /100 | #42 | Exceptional 11.0% |
| Celtics | 99.1 /100 | #43 | Exceptional 11.0% |
| Belgians | 99.1 /100 | #44 | Exceptional 11.0% |