Creek vs Alaskan Athabascan Median Family Income
COMPARE
Creek
Alaskan Athabascan
Median Family Income
Median Family Income Comparison
Creek
Alaskan Athabascans
$82,560
MEDIAN FAMILY INCOME
0.0/ 100
METRIC RATING
324th/ 347
METRIC RANK
$94,429
MEDIAN FAMILY INCOME
1.5/ 100
METRIC RATING
237th/ 347
METRIC RANK
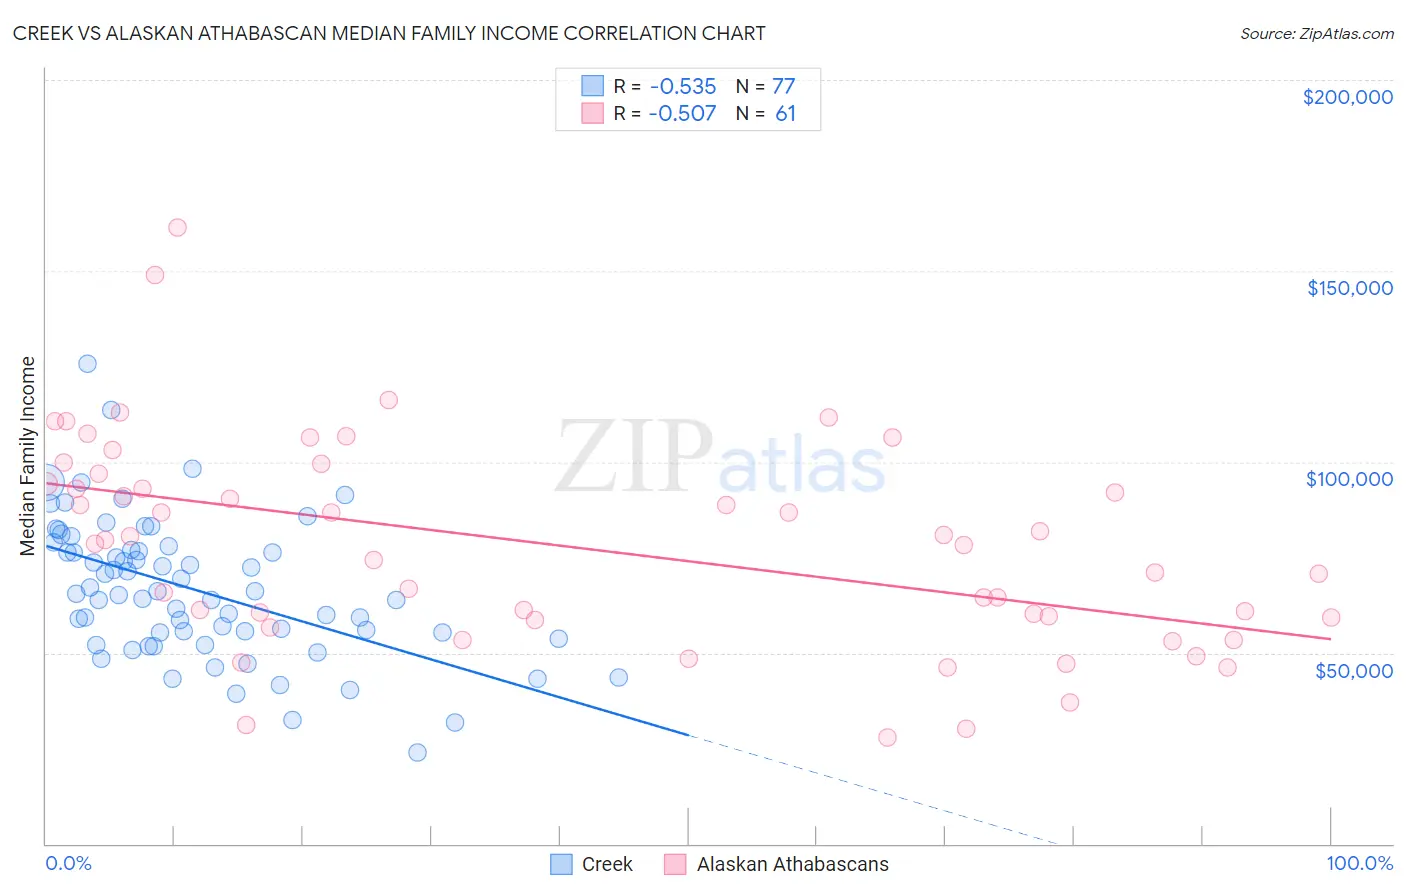
Creek vs Alaskan Athabascan Median Family Income Correlation Chart
The statistical analysis conducted on geographies consisting of 178,420,625 people shows a substantial negative correlation between the proportion of Creek and median family income in the United States with a correlation coefficient (R) of -0.535 and weighted average of $82,560. Similarly, the statistical analysis conducted on geographies consisting of 45,809,380 people shows a substantial negative correlation between the proportion of Alaskan Athabascans and median family income in the United States with a correlation coefficient (R) of -0.507 and weighted average of $94,429, a difference of 14.4%.
Median Family Income Correlation Summary
| Measurement | Creek | Alaskan Athabascan |
| Minimum | $23,750 | $27,750 |
| Maximum | $125,671 | $161,458 |
| Range | $101,921 | $133,708 |
| Mean | $66,532 | $77,954 |
| Median | $65,440 | $78,665 |
| Interquartile 25% (IQ1) | $54,458 | $58,765 |
| Interquartile 75% (IQ3) | $77,450 | $95,601 |
| Interquartile Range (IQR) | $22,992 | $36,836 |
| Standard Deviation (Sample) | $18,322 | $27,325 |
| Standard Deviation (Population) | $18,202 | $27,100 |
Similar Demographics by Median Family Income
Demographics Similar to Creek by Median Family Income
In terms of median family income, the demographic groups most similar to Creek are Bahamian ($82,631, a difference of 0.090%), Sioux ($82,386, a difference of 0.21%), Dominican ($82,888, a difference of 0.40%), Immigrants from Congo ($82,216, a difference of 0.42%), and Arapaho ($82,064, a difference of 0.61%).
| Demographics | Rating | Rank | Median Family Income |
| Yakama | 0.0 /100 | #317 | Tragic $83,932 |
| Immigrants | Mexico | 0.0 /100 | #318 | Tragic $83,639 |
| Immigrants | Honduras | 0.0 /100 | #319 | Tragic $83,618 |
| Seminole | 0.0 /100 | #320 | Tragic $83,354 |
| Immigrants | Caribbean | 0.0 /100 | #321 | Tragic $83,319 |
| Dominicans | 0.0 /100 | #322 | Tragic $82,888 |
| Bahamians | 0.0 /100 | #323 | Tragic $82,631 |
| Creek | 0.0 /100 | #324 | Tragic $82,560 |
| Sioux | 0.0 /100 | #325 | Tragic $82,386 |
| Immigrants | Congo | 0.0 /100 | #326 | Tragic $82,216 |
| Arapaho | 0.0 /100 | #327 | Tragic $82,064 |
| Blacks/African Americans | 0.0 /100 | #328 | Tragic $81,912 |
| Dutch West Indians | 0.0 /100 | #329 | Tragic $81,852 |
| Cheyenne | 0.0 /100 | #330 | Tragic $81,385 |
| Immigrants | Dominican Republic | 0.0 /100 | #331 | Tragic $81,233 |
Demographics Similar to Alaskan Athabascans by Median Family Income
In terms of median family income, the demographic groups most similar to Alaskan Athabascans are Immigrants from Burma/Myanmar ($94,472, a difference of 0.040%), Trinidadian and Tobagonian ($94,466, a difference of 0.040%), Immigrants from Western Africa ($94,638, a difference of 0.22%), Immigrants from Bangladesh ($94,665, a difference of 0.25%), and Nepalese ($94,153, a difference of 0.29%).
| Demographics | Rating | Rank | Median Family Income |
| Malaysians | 2.2 /100 | #230 | Tragic $95,230 |
| Ecuadorians | 2.1 /100 | #231 | Tragic $95,114 |
| Immigrants | Venezuela | 1.9 /100 | #232 | Tragic $94,904 |
| Immigrants | Bangladesh | 1.6 /100 | #233 | Tragic $94,665 |
| Immigrants | Western Africa | 1.6 /100 | #234 | Tragic $94,638 |
| Immigrants | Burma/Myanmar | 1.5 /100 | #235 | Tragic $94,472 |
| Trinidadians and Tobagonians | 1.5 /100 | #236 | Tragic $94,466 |
| Alaskan Athabascans | 1.5 /100 | #237 | Tragic $94,429 |
| Nepalese | 1.3 /100 | #238 | Tragic $94,153 |
| Salvadorans | 1.2 /100 | #239 | Tragic $94,109 |
| Somalis | 1.2 /100 | #240 | Tragic $94,085 |
| Immigrants | Trinidad and Tobago | 1.2 /100 | #241 | Tragic $93,988 |
| Barbadians | 1.1 /100 | #242 | Tragic $93,919 |
| German Russians | 1.1 /100 | #243 | Tragic $93,858 |
| Sub-Saharan Africans | 1.0 /100 | #244 | Tragic $93,748 |