Creek vs Immigrants from North Macedonia Disability Age 5 to 17
COMPARE
Creek
Immigrants from North Macedonia
Disability Age 5 to 17
Disability Age 5 to 17 Comparison
Creek
Immigrants from North Macedonia
6.9%
DISABILITY AGE 5 TO 17
0.0/ 100
METRIC RATING
337th/ 347
METRIC RANK
5.1%
DISABILITY AGE 5 TO 17
99.9/ 100
METRIC RATING
59th/ 347
METRIC RANK
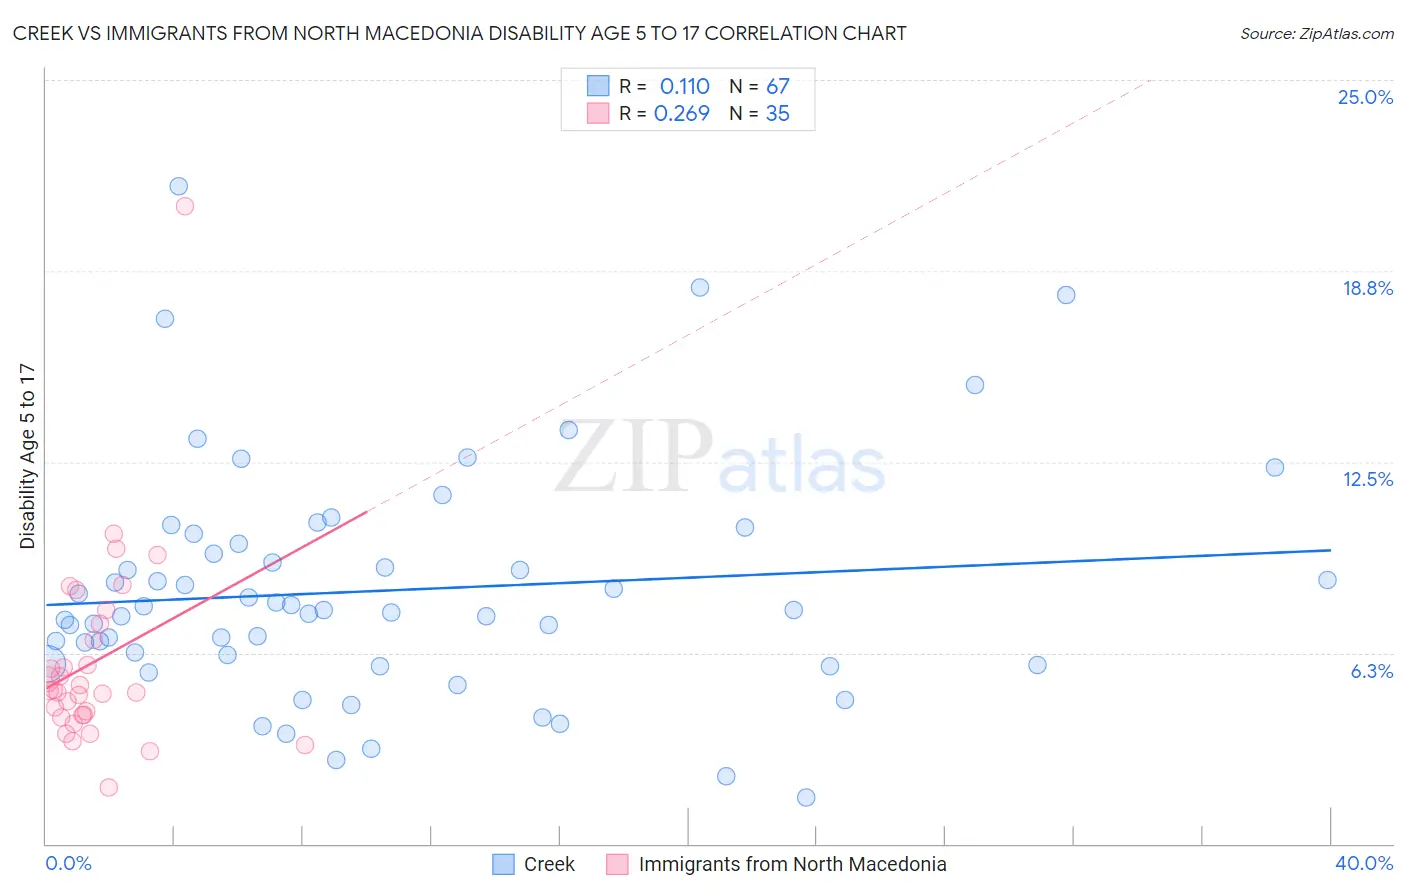
Creek vs Immigrants from North Macedonia Disability Age 5 to 17 Correlation Chart
The statistical analysis conducted on geographies consisting of 177,779,638 people shows a poor positive correlation between the proportion of Creek and percentage of population with a disability between the ages 5 and 17 in the United States with a correlation coefficient (R) of 0.110 and weighted average of 6.9%. Similarly, the statistical analysis conducted on geographies consisting of 74,064,473 people shows a weak positive correlation between the proportion of Immigrants from North Macedonia and percentage of population with a disability between the ages 5 and 17 in the United States with a correlation coefficient (R) of 0.269 and weighted average of 5.1%, a difference of 33.8%.
Disability Age 5 to 17 Correlation Summary
| Measurement | Creek | Immigrants from North Macedonia |
| Minimum | 1.5% | 1.9% |
| Maximum | 21.5% | 20.9% |
| Range | 20.0% | 19.0% |
| Mean | 8.3% | 6.0% |
| Median | 7.6% | 5.0% |
| Interquartile 25% (IQ1) | 5.9% | 4.2% |
| Interquartile 75% (IQ3) | 9.8% | 7.2% |
| Interquartile Range (IQR) | 4.0% | 3.0% |
| Standard Deviation (Sample) | 3.8% | 3.3% |
| Standard Deviation (Population) | 3.8% | 3.2% |
Similar Demographics by Disability Age 5 to 17
Demographics Similar to Creek by Disability Age 5 to 17
In terms of disability age 5 to 17, the demographic groups most similar to Creek are Iroquois (6.9%, a difference of 0.24%), Chickasaw (6.8%, a difference of 0.43%), Choctaw (6.9%, a difference of 0.57%), Cherokee (6.9%, a difference of 0.83%), and Ottawa (6.8%, a difference of 0.93%).
| Demographics | Rating | Rank | Disability Age 5 to 17 |
| Dutch West Indians | 0.0 /100 | #330 | Tragic 6.7% |
| French Canadians | 0.0 /100 | #331 | Tragic 6.7% |
| Immigrants | Azores | 0.0 /100 | #332 | Tragic 6.7% |
| Blacks/African Americans | 0.0 /100 | #333 | Tragic 6.8% |
| Seminole | 0.0 /100 | #334 | Tragic 6.8% |
| Ottawa | 0.0 /100 | #335 | Tragic 6.8% |
| Chickasaw | 0.0 /100 | #336 | Tragic 6.8% |
| Creek | 0.0 /100 | #337 | Tragic 6.9% |
| Iroquois | 0.0 /100 | #338 | Tragic 6.9% |
| Choctaw | 0.0 /100 | #339 | Tragic 6.9% |
| Cherokee | 0.0 /100 | #340 | Tragic 6.9% |
| Cape Verdeans | 0.0 /100 | #341 | Tragic 7.0% |
| Chippewa | 0.0 /100 | #342 | Tragic 7.1% |
| Immigrants | Cabo Verde | 0.0 /100 | #343 | Tragic 7.1% |
| Cajuns | 0.0 /100 | #344 | Tragic 7.2% |
Demographics Similar to Immigrants from North Macedonia by Disability Age 5 to 17
In terms of disability age 5 to 17, the demographic groups most similar to Immigrants from North Macedonia are Immigrants from Eastern Europe (5.1%, a difference of 0.11%), Immigrants from Ukraine (5.1%, a difference of 0.18%), Immigrants from Poland (5.1%, a difference of 0.26%), Immigrants from Turkey (5.1%, a difference of 0.41%), and Laotian (5.1%, a difference of 0.42%).
| Demographics | Rating | Rank | Disability Age 5 to 17 |
| Immigrants | Fiji | 99.9 /100 | #52 | Exceptional 5.1% |
| Immigrants | Lithuania | 99.9 /100 | #53 | Exceptional 5.1% |
| Paraguayans | 99.9 /100 | #54 | Exceptional 5.1% |
| Laotians | 99.9 /100 | #55 | Exceptional 5.1% |
| Immigrants | Turkey | 99.9 /100 | #56 | Exceptional 5.1% |
| Immigrants | Poland | 99.9 /100 | #57 | Exceptional 5.1% |
| Immigrants | Ukraine | 99.9 /100 | #58 | Exceptional 5.1% |
| Immigrants | North Macedonia | 99.9 /100 | #59 | Exceptional 5.1% |
| Immigrants | Eastern Europe | 99.9 /100 | #60 | Exceptional 5.1% |
| Immigrants | Switzerland | 99.8 /100 | #61 | Exceptional 5.2% |
| Immigrants | Ireland | 99.8 /100 | #62 | Exceptional 5.2% |
| Immigrants | Bangladesh | 99.8 /100 | #63 | Exceptional 5.2% |
| Immigrants | South Eastern Asia | 99.8 /100 | #64 | Exceptional 5.2% |
| Immigrants | Greece | 99.8 /100 | #65 | Exceptional 5.2% |
| Palestinians | 99.8 /100 | #66 | Exceptional 5.2% |