Creek vs Mongolian Disability Age 5 to 17
COMPARE
Creek
Mongolian
Disability Age 5 to 17
Disability Age 5 to 17 Comparison
Creek
Mongolians
6.9%
DISABILITY AGE 5 TO 17
0.0/ 100
METRIC RATING
337th/ 347
METRIC RANK
5.3%
DISABILITY AGE 5 TO 17
99.2/ 100
METRIC RATING
91st/ 347
METRIC RANK
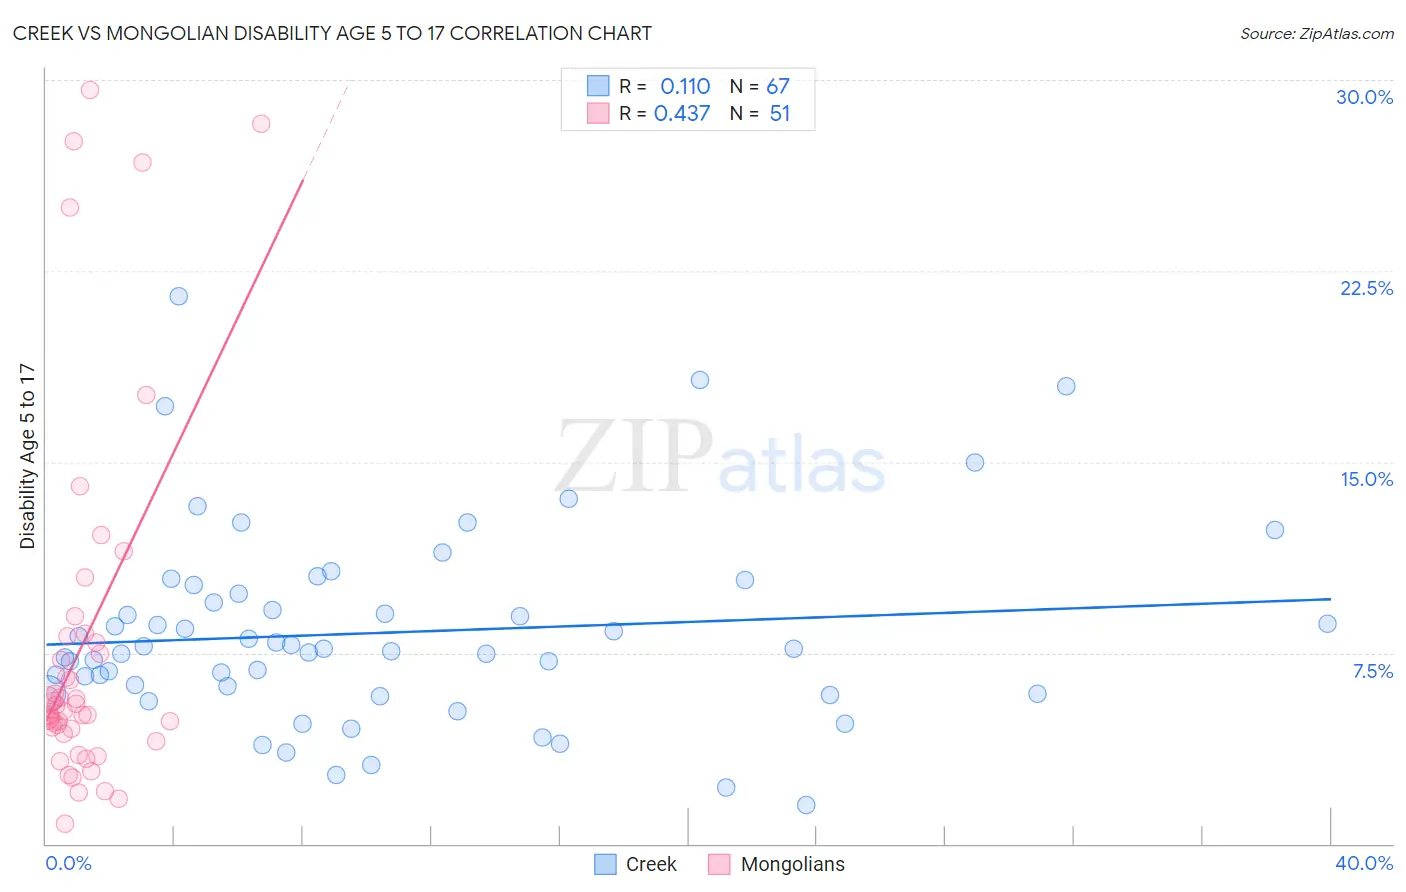
Creek vs Mongolian Disability Age 5 to 17 Correlation Chart
The statistical analysis conducted on geographies consisting of 177,779,638 people shows a poor positive correlation between the proportion of Creek and percentage of population with a disability between the ages 5 and 17 in the United States with a correlation coefficient (R) of 0.110 and weighted average of 6.9%. Similarly, the statistical analysis conducted on geographies consisting of 139,966,367 people shows a moderate positive correlation between the proportion of Mongolians and percentage of population with a disability between the ages 5 and 17 in the United States with a correlation coefficient (R) of 0.437 and weighted average of 5.3%, a difference of 30.4%.
Disability Age 5 to 17 Correlation Summary
| Measurement | Creek | Mongolian |
| Minimum | 1.5% | 0.80% |
| Maximum | 21.5% | 29.6% |
| Range | 20.0% | 28.8% |
| Mean | 8.3% | 7.9% |
| Median | 7.6% | 5.2% |
| Interquartile 25% (IQ1) | 5.9% | 4.3% |
| Interquartile 75% (IQ3) | 9.8% | 8.1% |
| Interquartile Range (IQR) | 4.0% | 3.8% |
| Standard Deviation (Sample) | 3.8% | 7.2% |
| Standard Deviation (Population) | 3.8% | 7.1% |
Similar Demographics by Disability Age 5 to 17
Demographics Similar to Creek by Disability Age 5 to 17
In terms of disability age 5 to 17, the demographic groups most similar to Creek are Iroquois (6.9%, a difference of 0.24%), Chickasaw (6.8%, a difference of 0.43%), Choctaw (6.9%, a difference of 0.57%), Cherokee (6.9%, a difference of 0.83%), and Ottawa (6.8%, a difference of 0.93%).
| Demographics | Rating | Rank | Disability Age 5 to 17 |
| Dutch West Indians | 0.0 /100 | #330 | Tragic 6.7% |
| French Canadians | 0.0 /100 | #331 | Tragic 6.7% |
| Immigrants | Azores | 0.0 /100 | #332 | Tragic 6.7% |
| Blacks/African Americans | 0.0 /100 | #333 | Tragic 6.8% |
| Seminole | 0.0 /100 | #334 | Tragic 6.8% |
| Ottawa | 0.0 /100 | #335 | Tragic 6.8% |
| Chickasaw | 0.0 /100 | #336 | Tragic 6.8% |
| Creek | 0.0 /100 | #337 | Tragic 6.9% |
| Iroquois | 0.0 /100 | #338 | Tragic 6.9% |
| Choctaw | 0.0 /100 | #339 | Tragic 6.9% |
| Cherokee | 0.0 /100 | #340 | Tragic 6.9% |
| Cape Verdeans | 0.0 /100 | #341 | Tragic 7.0% |
| Chippewa | 0.0 /100 | #342 | Tragic 7.1% |
| Immigrants | Cabo Verde | 0.0 /100 | #343 | Tragic 7.1% |
| Cajuns | 0.0 /100 | #344 | Tragic 7.2% |
Demographics Similar to Mongolians by Disability Age 5 to 17
In terms of disability age 5 to 17, the demographic groups most similar to Mongolians are Luxembourger (5.3%, a difference of 0.010%), Immigrants from Peru (5.3%, a difference of 0.090%), Immigrants from Jordan (5.3%, a difference of 0.16%), Immigrants from Grenada (5.3%, a difference of 0.18%), and Immigrants from Kuwait (5.3%, a difference of 0.29%).
| Demographics | Rating | Rank | Disability Age 5 to 17 |
| Immigrants | Nicaragua | 99.5 /100 | #84 | Exceptional 5.2% |
| Bulgarians | 99.4 /100 | #85 | Exceptional 5.2% |
| Immigrants | St. Vincent and the Grenadines | 99.4 /100 | #86 | Exceptional 5.2% |
| Eastern Europeans | 99.4 /100 | #87 | Exceptional 5.2% |
| Immigrants | Croatia | 99.4 /100 | #88 | Exceptional 5.2% |
| Immigrants | Spain | 99.4 /100 | #89 | Exceptional 5.2% |
| Immigrants | Kuwait | 99.4 /100 | #90 | Exceptional 5.3% |
| Mongolians | 99.2 /100 | #91 | Exceptional 5.3% |
| Luxembourgers | 99.2 /100 | #92 | Exceptional 5.3% |
| Immigrants | Peru | 99.1 /100 | #93 | Exceptional 5.3% |
| Immigrants | Jordan | 99.1 /100 | #94 | Exceptional 5.3% |
| Immigrants | Grenada | 99.1 /100 | #95 | Exceptional 5.3% |
| Immigrants | El Salvador | 99.0 /100 | #96 | Exceptional 5.3% |
| Immigrants | Europe | 99.0 /100 | #97 | Exceptional 5.3% |
| Immigrants | Austria | 98.9 /100 | #98 | Exceptional 5.3% |