Cree vs Immigrants from the Azores Vision Disability
COMPARE
Cree
Immigrants from the Azores
Vision Disability
Vision Disability Comparison
Cree
Immigrants from the Azores
2.5%
VISION DISABILITY
0.0/ 100
METRIC RATING
299th/ 347
METRIC RANK
2.4%
VISION DISABILITY
0.1/ 100
METRIC RATING
271st/ 347
METRIC RANK
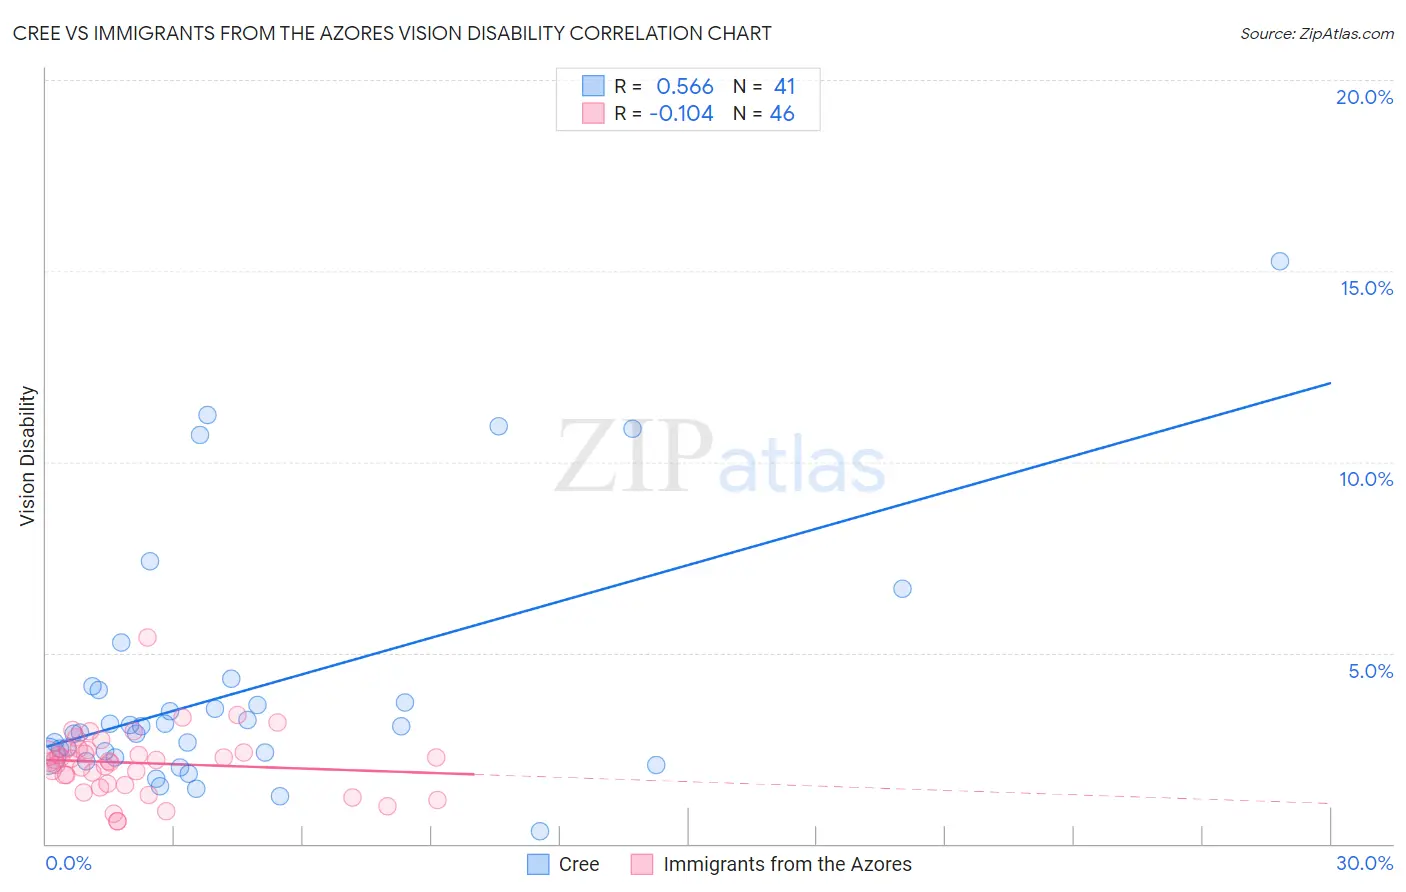
Cree vs Immigrants from the Azores Vision Disability Correlation Chart
The statistical analysis conducted on geographies consisting of 76,198,383 people shows a substantial positive correlation between the proportion of Cree and percentage of population with vision disability in the United States with a correlation coefficient (R) of 0.566 and weighted average of 2.5%. Similarly, the statistical analysis conducted on geographies consisting of 46,255,686 people shows a poor negative correlation between the proportion of Immigrants from the Azores and percentage of population with vision disability in the United States with a correlation coefficient (R) of -0.104 and weighted average of 2.4%, a difference of 5.1%.
Vision Disability Correlation Summary
| Measurement | Cree | Immigrants from the Azores |
| Minimum | 0.32% | 0.57% |
| Maximum | 15.3% | 5.4% |
| Range | 14.9% | 4.8% |
| Mean | 4.1% | 2.1% |
| Median | 3.1% | 2.2% |
| Interquartile 25% (IQ1) | 2.3% | 1.6% |
| Interquartile 75% (IQ3) | 4.1% | 2.5% |
| Interquartile Range (IQR) | 1.8% | 0.89% |
| Standard Deviation (Sample) | 3.2% | 0.85% |
| Standard Deviation (Population) | 3.2% | 0.84% |
Similar Demographics by Vision Disability
Demographics Similar to Cree by Vision Disability
In terms of vision disability, the demographic groups most similar to Cree are Mexican (2.5%, a difference of 0.040%), Immigrants from Dominica (2.5%, a difference of 0.17%), African (2.5%, a difference of 0.20%), Menominee (2.5%, a difference of 0.38%), and Immigrants from Mexico (2.5%, a difference of 0.86%).
| Demographics | Rating | Rank | Vision Disability |
| Crow | 0.0 /100 | #292 | Tragic 2.5% |
| Yaqui | 0.0 /100 | #293 | Tragic 2.5% |
| Ottawa | 0.0 /100 | #294 | Tragic 2.5% |
| Delaware | 0.0 /100 | #295 | Tragic 2.5% |
| Immigrants | Mexico | 0.0 /100 | #296 | Tragic 2.5% |
| Immigrants | Dominica | 0.0 /100 | #297 | Tragic 2.5% |
| Mexicans | 0.0 /100 | #298 | Tragic 2.5% |
| Cree | 0.0 /100 | #299 | Tragic 2.5% |
| Africans | 0.0 /100 | #300 | Tragic 2.5% |
| Menominee | 0.0 /100 | #301 | Tragic 2.5% |
| Spanish American Indians | 0.0 /100 | #302 | Tragic 2.6% |
| Immigrants | Cabo Verde | 0.0 /100 | #303 | Tragic 2.6% |
| Aleuts | 0.0 /100 | #304 | Tragic 2.6% |
| Hispanics or Latinos | 0.0 /100 | #305 | Tragic 2.6% |
| Iroquois | 0.0 /100 | #306 | Tragic 2.6% |
Demographics Similar to Immigrants from the Azores by Vision Disability
In terms of vision disability, the demographic groups most similar to Immigrants from the Azores are Spaniard (2.4%, a difference of 0.10%), Celtic (2.4%, a difference of 0.16%), Cuban (2.4%, a difference of 0.16%), Immigrants from Bahamas (2.4%, a difference of 0.43%), and Senegalese (2.4%, a difference of 0.44%).
| Demographics | Rating | Rank | Vision Disability |
| Immigrants | Liberia | 0.1 /100 | #264 | Tragic 2.4% |
| Immigrants | Jamaica | 0.1 /100 | #265 | Tragic 2.4% |
| Mexican American Indians | 0.1 /100 | #266 | Tragic 2.4% |
| Ute | 0.1 /100 | #267 | Tragic 2.4% |
| Senegalese | 0.1 /100 | #268 | Tragic 2.4% |
| Celtics | 0.1 /100 | #269 | Tragic 2.4% |
| Cubans | 0.1 /100 | #270 | Tragic 2.4% |
| Immigrants | Azores | 0.1 /100 | #271 | Tragic 2.4% |
| Spaniards | 0.1 /100 | #272 | Tragic 2.4% |
| Immigrants | Bahamas | 0.1 /100 | #273 | Tragic 2.4% |
| Immigrants | Latin America | 0.0 /100 | #274 | Tragic 2.4% |
| Chippewa | 0.0 /100 | #275 | Tragic 2.4% |
| Scotch-Irish | 0.0 /100 | #276 | Tragic 2.4% |
| Bahamians | 0.0 /100 | #277 | Tragic 2.4% |
| Spanish | 0.0 /100 | #278 | Tragic 2.4% |