Central American vs Immigrants from the Azores Vision Disability
COMPARE
Central American
Immigrants from the Azores
Vision Disability
Vision Disability Comparison
Central Americans
Immigrants from the Azores
2.3%
VISION DISABILITY
1.8/ 100
METRIC RATING
233rd/ 347
METRIC RANK
2.4%
VISION DISABILITY
0.1/ 100
METRIC RATING
271st/ 347
METRIC RANK
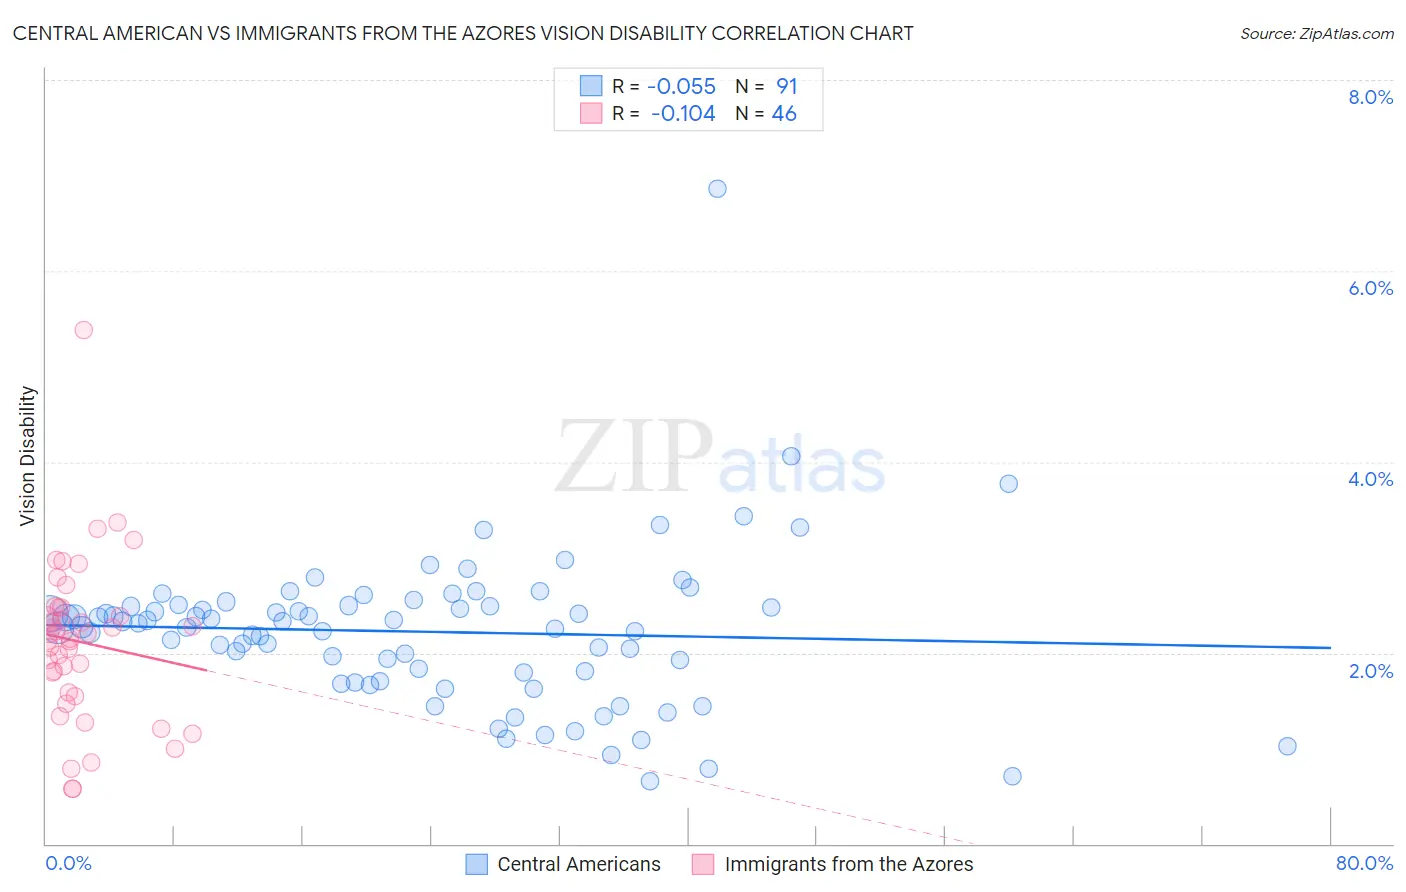
Central American vs Immigrants from the Azores Vision Disability Correlation Chart
The statistical analysis conducted on geographies consisting of 503,926,566 people shows a slight negative correlation between the proportion of Central Americans and percentage of population with vision disability in the United States with a correlation coefficient (R) of -0.055 and weighted average of 2.3%. Similarly, the statistical analysis conducted on geographies consisting of 46,255,686 people shows a poor negative correlation between the proportion of Immigrants from the Azores and percentage of population with vision disability in the United States with a correlation coefficient (R) of -0.104 and weighted average of 2.4%, a difference of 4.7%.
Vision Disability Correlation Summary
| Measurement | Central American | Immigrants from the Azores |
| Minimum | 0.66% | 0.57% |
| Maximum | 6.9% | 5.4% |
| Range | 6.2% | 4.8% |
| Mean | 2.2% | 2.1% |
| Median | 2.3% | 2.2% |
| Interquartile 25% (IQ1) | 1.8% | 1.6% |
| Interquartile 75% (IQ3) | 2.5% | 2.5% |
| Interquartile Range (IQR) | 0.71% | 0.89% |
| Standard Deviation (Sample) | 0.81% | 0.85% |
| Standard Deviation (Population) | 0.81% | 0.84% |
Similar Demographics by Vision Disability
Demographics Similar to Central Americans by Vision Disability
In terms of vision disability, the demographic groups most similar to Central Americans are German Russian (2.3%, a difference of 0.020%), Scottish (2.3%, a difference of 0.18%), Immigrants from Ecuador (2.3%, a difference of 0.20%), Marshallese (2.3%, a difference of 0.25%), and Immigrants from Congo (2.3%, a difference of 0.34%).
| Demographics | Rating | Rank | Vision Disability |
| Immigrants | Germany | 3.0 /100 | #226 | Tragic 2.3% |
| Hawaiians | 2.9 /100 | #227 | Tragic 2.3% |
| Hmong | 2.5 /100 | #228 | Tragic 2.3% |
| Welsh | 2.3 /100 | #229 | Tragic 2.3% |
| Nicaraguans | 2.2 /100 | #230 | Tragic 2.3% |
| Immigrants | Ecuador | 2.0 /100 | #231 | Tragic 2.3% |
| German Russians | 1.8 /100 | #232 | Tragic 2.3% |
| Central Americans | 1.8 /100 | #233 | Tragic 2.3% |
| Scottish | 1.6 /100 | #234 | Tragic 2.3% |
| Marshallese | 1.5 /100 | #235 | Tragic 2.3% |
| Immigrants | Congo | 1.4 /100 | #236 | Tragic 2.3% |
| Immigrants | Portugal | 1.4 /100 | #237 | Tragic 2.3% |
| Immigrants | Cambodia | 1.1 /100 | #238 | Tragic 2.3% |
| English | 1.1 /100 | #239 | Tragic 2.3% |
| Panamanians | 0.9 /100 | #240 | Tragic 2.3% |
Demographics Similar to Immigrants from the Azores by Vision Disability
In terms of vision disability, the demographic groups most similar to Immigrants from the Azores are Spaniard (2.4%, a difference of 0.10%), Celtic (2.4%, a difference of 0.16%), Cuban (2.4%, a difference of 0.16%), Immigrants from Bahamas (2.4%, a difference of 0.43%), and Senegalese (2.4%, a difference of 0.44%).
| Demographics | Rating | Rank | Vision Disability |
| Immigrants | Liberia | 0.1 /100 | #264 | Tragic 2.4% |
| Immigrants | Jamaica | 0.1 /100 | #265 | Tragic 2.4% |
| Mexican American Indians | 0.1 /100 | #266 | Tragic 2.4% |
| Ute | 0.1 /100 | #267 | Tragic 2.4% |
| Senegalese | 0.1 /100 | #268 | Tragic 2.4% |
| Celtics | 0.1 /100 | #269 | Tragic 2.4% |
| Cubans | 0.1 /100 | #270 | Tragic 2.4% |
| Immigrants | Azores | 0.1 /100 | #271 | Tragic 2.4% |
| Spaniards | 0.1 /100 | #272 | Tragic 2.4% |
| Immigrants | Bahamas | 0.1 /100 | #273 | Tragic 2.4% |
| Immigrants | Latin America | 0.0 /100 | #274 | Tragic 2.4% |
| Chippewa | 0.0 /100 | #275 | Tragic 2.4% |
| Scotch-Irish | 0.0 /100 | #276 | Tragic 2.4% |
| Bahamians | 0.0 /100 | #277 | Tragic 2.4% |
| Spanish | 0.0 /100 | #278 | Tragic 2.4% |