Argentinean vs Immigrants from the Azores Vision Disability
COMPARE
Argentinean
Immigrants from the Azores
Vision Disability
Vision Disability Comparison
Argentineans
Immigrants from the Azores
2.0%
VISION DISABILITY
99.1/ 100
METRIC RATING
59th/ 347
METRIC RANK
2.4%
VISION DISABILITY
0.1/ 100
METRIC RATING
271st/ 347
METRIC RANK
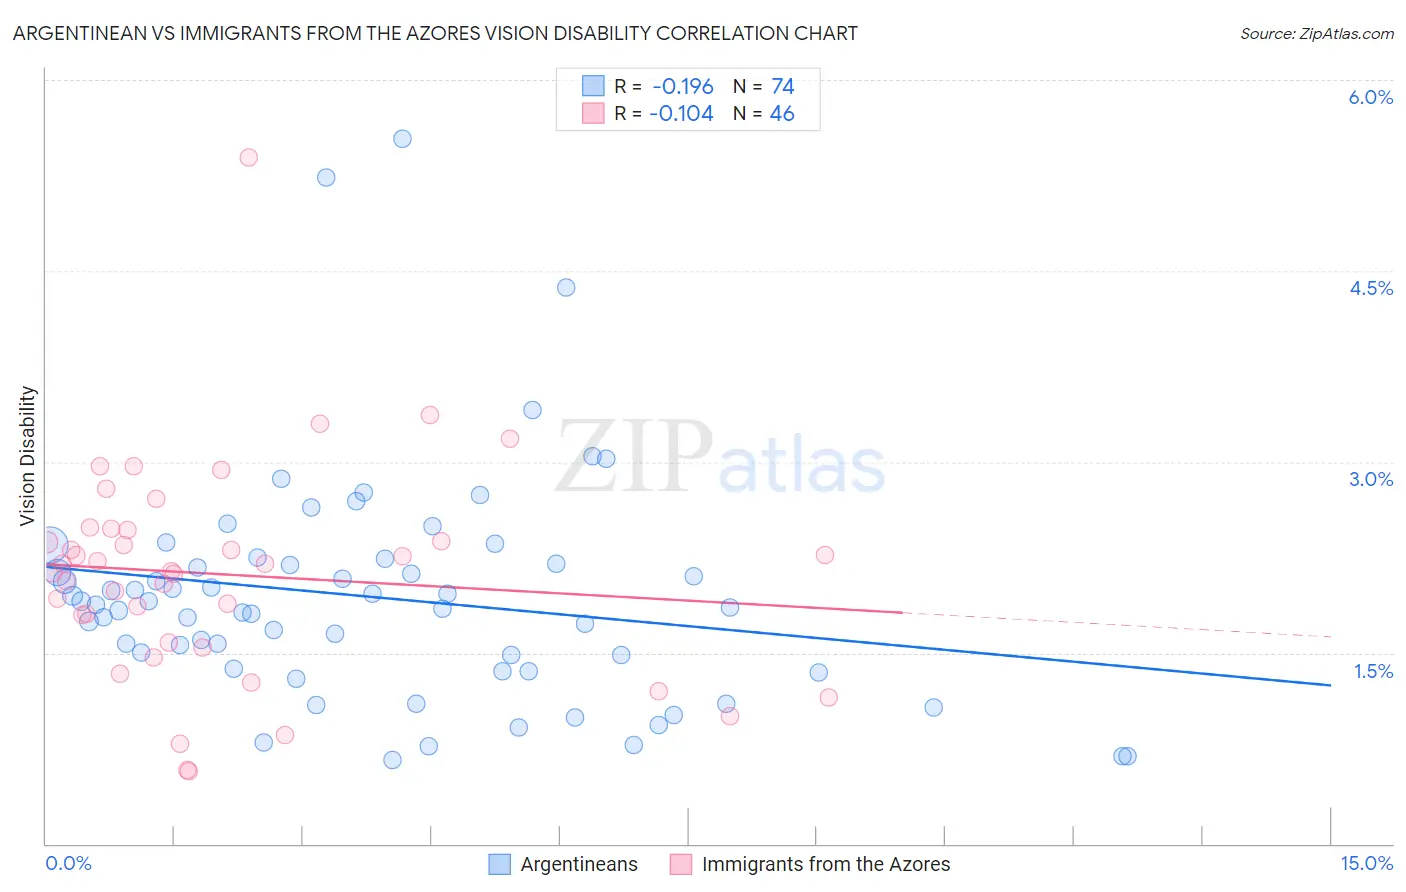
Argentinean vs Immigrants from the Azores Vision Disability Correlation Chart
The statistical analysis conducted on geographies consisting of 297,071,793 people shows a poor negative correlation between the proportion of Argentineans and percentage of population with vision disability in the United States with a correlation coefficient (R) of -0.196 and weighted average of 2.0%. Similarly, the statistical analysis conducted on geographies consisting of 46,255,686 people shows a poor negative correlation between the proportion of Immigrants from the Azores and percentage of population with vision disability in the United States with a correlation coefficient (R) of -0.104 and weighted average of 2.4%, a difference of 20.3%.
Vision Disability Correlation Summary
| Measurement | Argentinean | Immigrants from the Azores |
| Minimum | 0.66% | 0.57% |
| Maximum | 5.5% | 5.4% |
| Range | 4.9% | 4.8% |
| Mean | 1.9% | 2.1% |
| Median | 1.9% | 2.2% |
| Interquartile 25% (IQ1) | 1.4% | 1.6% |
| Interquartile 75% (IQ3) | 2.2% | 2.5% |
| Interquartile Range (IQR) | 0.82% | 0.89% |
| Standard Deviation (Sample) | 0.89% | 0.85% |
| Standard Deviation (Population) | 0.89% | 0.84% |
Similar Demographics by Vision Disability
Demographics Similar to Argentineans by Vision Disability
In terms of vision disability, the demographic groups most similar to Argentineans are Immigrants from Romania (2.0%, a difference of 0.030%), Immigrants from Belgium (2.0%, a difference of 0.040%), Immigrants from Russia (2.0%, a difference of 0.060%), Immigrants from Saudi Arabia (2.0%, a difference of 0.14%), and Armenian (2.0%, a difference of 0.17%).
| Demographics | Rating | Rank | Vision Disability |
| Immigrants | Serbia | 99.4 /100 | #52 | Exceptional 2.0% |
| Immigrants | Belarus | 99.3 /100 | #53 | Exceptional 2.0% |
| Macedonians | 99.3 /100 | #54 | Exceptional 2.0% |
| Laotians | 99.3 /100 | #55 | Exceptional 2.0% |
| Jordanians | 99.2 /100 | #56 | Exceptional 2.0% |
| Somalis | 99.2 /100 | #57 | Exceptional 2.0% |
| Immigrants | Saudi Arabia | 99.2 /100 | #58 | Exceptional 2.0% |
| Argentineans | 99.1 /100 | #59 | Exceptional 2.0% |
| Immigrants | Romania | 99.1 /100 | #60 | Exceptional 2.0% |
| Immigrants | Belgium | 99.1 /100 | #61 | Exceptional 2.0% |
| Immigrants | Russia | 99.1 /100 | #62 | Exceptional 2.0% |
| Armenians | 99.0 /100 | #63 | Exceptional 2.0% |
| Immigrants | Greece | 99.0 /100 | #64 | Exceptional 2.0% |
| Maltese | 98.9 /100 | #65 | Exceptional 2.0% |
| Immigrants | Argentina | 98.9 /100 | #66 | Exceptional 2.0% |
Demographics Similar to Immigrants from the Azores by Vision Disability
In terms of vision disability, the demographic groups most similar to Immigrants from the Azores are Spaniard (2.4%, a difference of 0.10%), Celtic (2.4%, a difference of 0.16%), Cuban (2.4%, a difference of 0.16%), Immigrants from Bahamas (2.4%, a difference of 0.43%), and Senegalese (2.4%, a difference of 0.44%).
| Demographics | Rating | Rank | Vision Disability |
| Immigrants | Liberia | 0.1 /100 | #264 | Tragic 2.4% |
| Immigrants | Jamaica | 0.1 /100 | #265 | Tragic 2.4% |
| Mexican American Indians | 0.1 /100 | #266 | Tragic 2.4% |
| Ute | 0.1 /100 | #267 | Tragic 2.4% |
| Senegalese | 0.1 /100 | #268 | Tragic 2.4% |
| Celtics | 0.1 /100 | #269 | Tragic 2.4% |
| Cubans | 0.1 /100 | #270 | Tragic 2.4% |
| Immigrants | Azores | 0.1 /100 | #271 | Tragic 2.4% |
| Spaniards | 0.1 /100 | #272 | Tragic 2.4% |
| Immigrants | Bahamas | 0.1 /100 | #273 | Tragic 2.4% |
| Immigrants | Latin America | 0.0 /100 | #274 | Tragic 2.4% |
| Chippewa | 0.0 /100 | #275 | Tragic 2.4% |
| Scotch-Irish | 0.0 /100 | #276 | Tragic 2.4% |
| Bahamians | 0.0 /100 | #277 | Tragic 2.4% |
| Spanish | 0.0 /100 | #278 | Tragic 2.4% |