Cree vs Immigrants from the Azores Unemployment Among Ages 16 to 19 years
COMPARE
Cree
Immigrants from the Azores
Unemployment Among Ages 16 to 19 years
Unemployment Among Ages 16 to 19 years Comparison
Cree
Immigrants from the Azores
19.0%
UNEMPLOYMENT AMONG AGES 16 TO 19 YEARS
0.1/ 100
METRIC RATING
263rd/ 347
METRIC RANK
19.8%
UNEMPLOYMENT AMONG AGES 16 TO 19 YEARS
0.0/ 100
METRIC RATING
288th/ 347
METRIC RANK
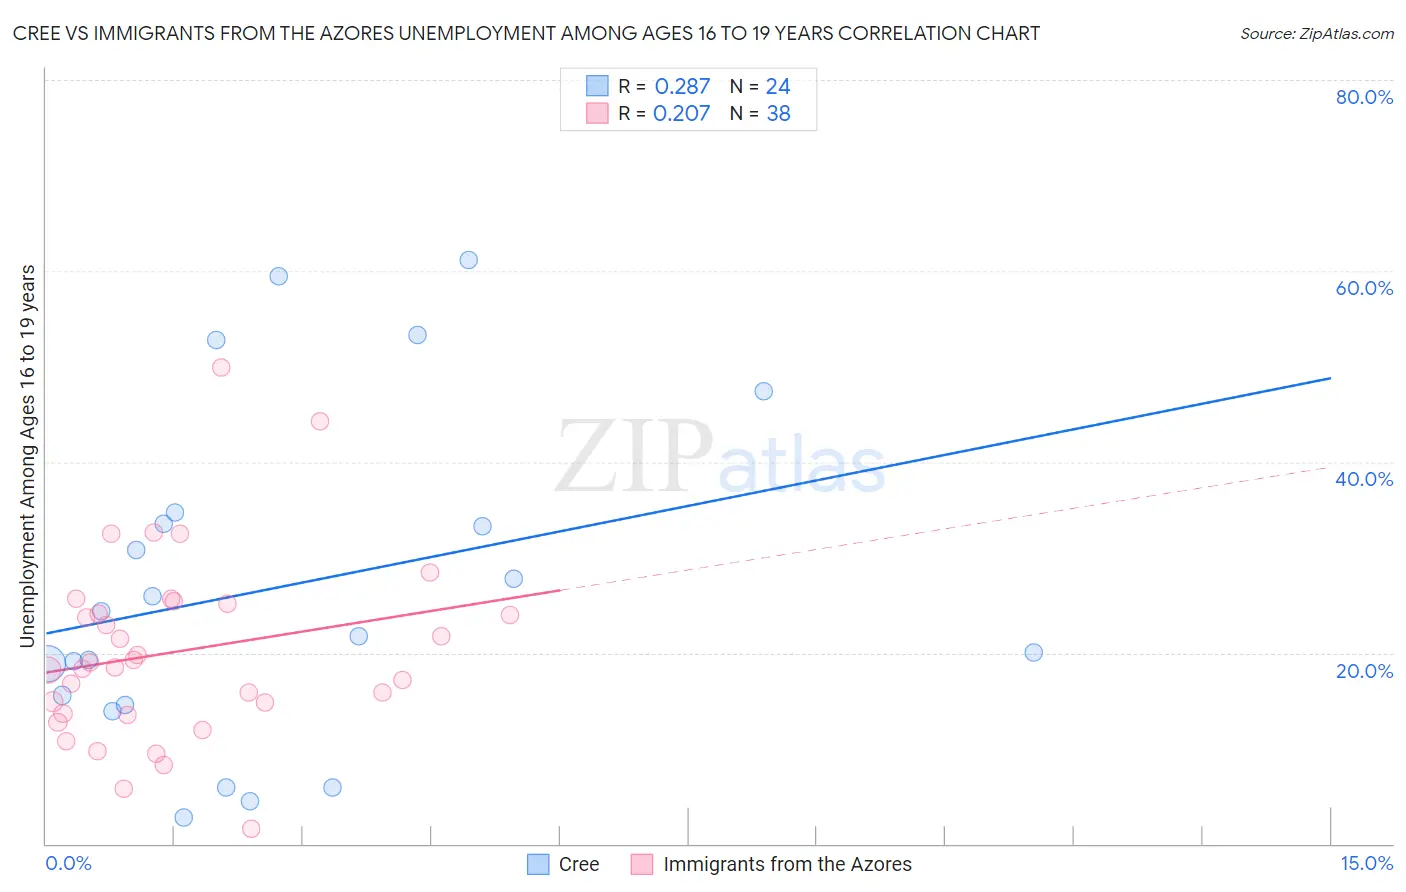
Cree vs Immigrants from the Azores Unemployment Among Ages 16 to 19 years Correlation Chart
The statistical analysis conducted on geographies consisting of 75,078,249 people shows a weak positive correlation between the proportion of Cree and unemployment rate among population between the ages 16 and 19 in the United States with a correlation coefficient (R) of 0.287 and weighted average of 19.0%. Similarly, the statistical analysis conducted on geographies consisting of 45,348,079 people shows a weak positive correlation between the proportion of Immigrants from the Azores and unemployment rate among population between the ages 16 and 19 in the United States with a correlation coefficient (R) of 0.207 and weighted average of 19.8%, a difference of 4.5%.
Unemployment Among Ages 16 to 19 years Correlation Summary
| Measurement | Cree | Immigrants from the Azores |
| Minimum | 2.8% | 1.6% |
| Maximum | 61.1% | 49.9% |
| Range | 58.3% | 48.3% |
| Mean | 26.9% | 20.1% |
| Median | 23.1% | 18.7% |
| Interquartile 25% (IQ1) | 15.0% | 13.6% |
| Interquartile 75% (IQ3) | 34.1% | 25.2% |
| Interquartile Range (IQR) | 19.1% | 11.6% |
| Standard Deviation (Sample) | 17.3% | 9.7% |
| Standard Deviation (Population) | 16.9% | 9.6% |
Similar Demographics by Unemployment Among Ages 16 to 19 years
Demographics Similar to Cree by Unemployment Among Ages 16 to 19 years
In terms of unemployment among ages 16 to 19 years, the demographic groups most similar to Cree are Yaqui (19.0%, a difference of 0.030%), Choctaw (19.0%, a difference of 0.040%), Salvadoran (18.9%, a difference of 0.13%), Immigrants from Honduras (19.0%, a difference of 0.13%), and Spanish American Indian (18.9%, a difference of 0.17%).
| Demographics | Rating | Rank | Unemployment Among Ages 16 to 19 years |
| Mexican American Indians | 0.3 /100 | #256 | Tragic 18.8% |
| Immigrants | Nigeria | 0.2 /100 | #257 | Tragic 18.9% |
| Immigrants | Mexico | 0.2 /100 | #258 | Tragic 18.9% |
| Immigrants | Central America | 0.2 /100 | #259 | Tragic 18.9% |
| Nigerians | 0.2 /100 | #260 | Tragic 18.9% |
| Spanish American Indians | 0.1 /100 | #261 | Tragic 18.9% |
| Salvadorans | 0.1 /100 | #262 | Tragic 18.9% |
| Cree | 0.1 /100 | #263 | Tragic 19.0% |
| Yaqui | 0.1 /100 | #264 | Tragic 19.0% |
| Choctaw | 0.1 /100 | #265 | Tragic 19.0% |
| Immigrants | Honduras | 0.1 /100 | #266 | Tragic 19.0% |
| Israelis | 0.1 /100 | #267 | Tragic 19.0% |
| Immigrants | El Salvador | 0.1 /100 | #268 | Tragic 19.1% |
| Lumbee | 0.1 /100 | #269 | Tragic 19.1% |
| Hondurans | 0.1 /100 | #270 | Tragic 19.2% |
Demographics Similar to Immigrants from the Azores by Unemployment Among Ages 16 to 19 years
In terms of unemployment among ages 16 to 19 years, the demographic groups most similar to Immigrants from the Azores are Immigrants from Ghana (19.8%, a difference of 0.12%), Pueblo (19.8%, a difference of 0.17%), Bahamian (19.8%, a difference of 0.18%), Ghanaian (19.8%, a difference of 0.31%), and Sierra Leonean (19.7%, a difference of 0.49%).
| Demographics | Rating | Rank | Unemployment Among Ages 16 to 19 years |
| Cypriots | 0.0 /100 | #281 | Tragic 19.6% |
| Dutch West Indians | 0.0 /100 | #282 | Tragic 19.7% |
| Sioux | 0.0 /100 | #283 | Tragic 19.7% |
| Sierra Leoneans | 0.0 /100 | #284 | Tragic 19.7% |
| Ghanaians | 0.0 /100 | #285 | Tragic 19.8% |
| Bahamians | 0.0 /100 | #286 | Tragic 19.8% |
| Immigrants | Ghana | 0.0 /100 | #287 | Tragic 19.8% |
| Immigrants | Azores | 0.0 /100 | #288 | Tragic 19.8% |
| Pueblo | 0.0 /100 | #289 | Tragic 19.8% |
| Immigrants | Sierra Leone | 0.0 /100 | #290 | Tragic 20.0% |
| Immigrants | Yemen | 0.0 /100 | #291 | Tragic 20.0% |
| Comanche | 0.0 /100 | #292 | Tragic 20.2% |
| Immigrants | Bahamas | 0.0 /100 | #293 | Tragic 20.4% |
| Immigrants | Haiti | 0.0 /100 | #294 | Tragic 20.4% |
| Central American Indians | 0.0 /100 | #295 | Tragic 20.4% |