Belizean vs Immigrants from the Azores Vision Disability
COMPARE
Belizean
Immigrants from the Azores
Vision Disability
Vision Disability Comparison
Belizeans
Immigrants from the Azores
2.4%
VISION DISABILITY
0.2/ 100
METRIC RATING
260th/ 347
METRIC RANK
2.4%
VISION DISABILITY
0.1/ 100
METRIC RATING
271st/ 347
METRIC RANK
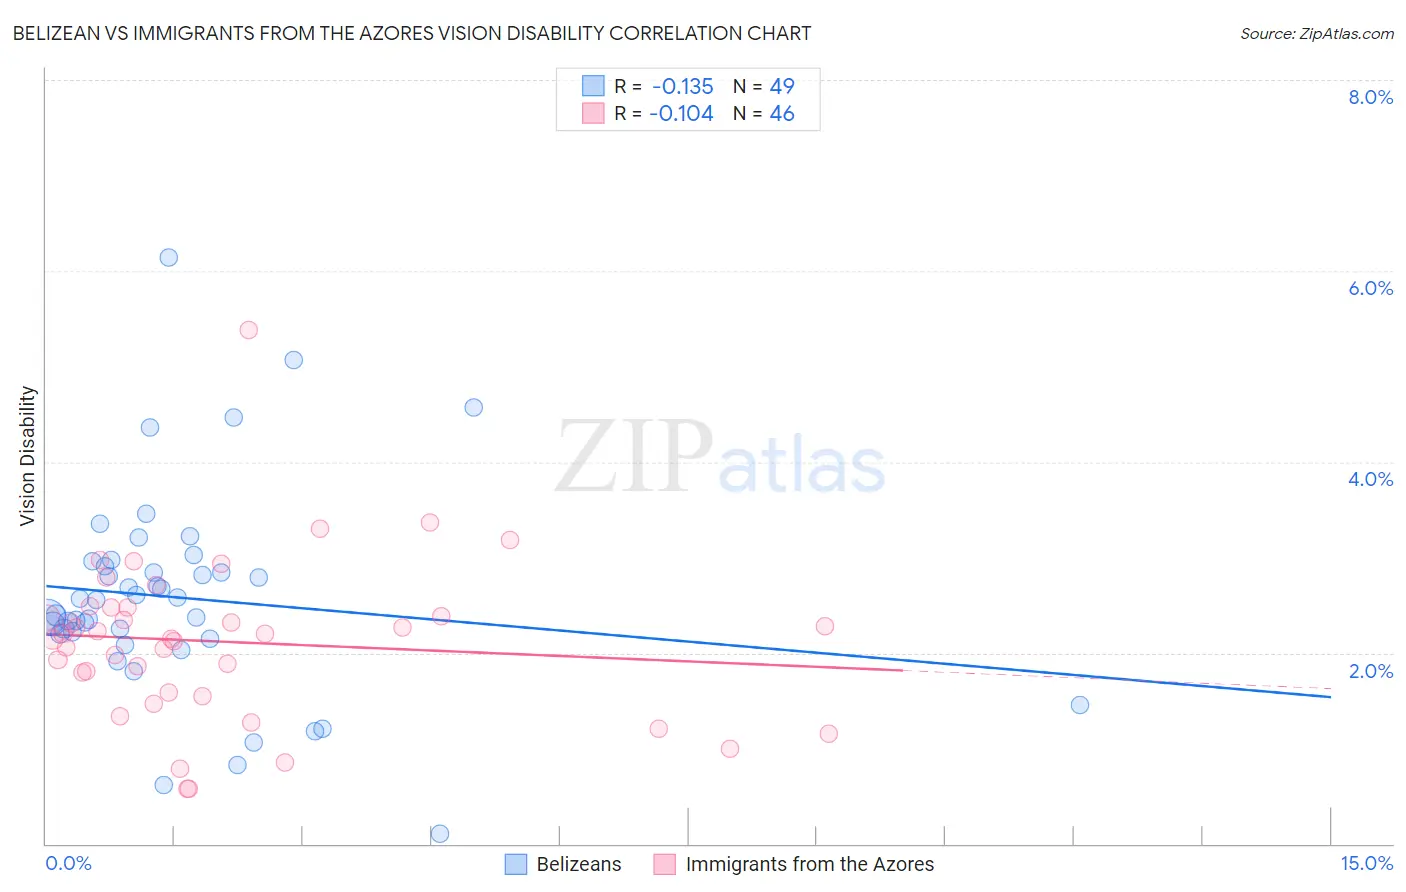
Belizean vs Immigrants from the Azores Vision Disability Correlation Chart
The statistical analysis conducted on geographies consisting of 144,166,801 people shows a poor negative correlation between the proportion of Belizeans and percentage of population with vision disability in the United States with a correlation coefficient (R) of -0.135 and weighted average of 2.4%. Similarly, the statistical analysis conducted on geographies consisting of 46,255,686 people shows a poor negative correlation between the proportion of Immigrants from the Azores and percentage of population with vision disability in the United States with a correlation coefficient (R) of -0.104 and weighted average of 2.4%, a difference of 1.2%.
Vision Disability Correlation Summary
| Measurement | Belizean | Immigrants from the Azores |
| Minimum | 0.11% | 0.57% |
| Maximum | 6.1% | 5.4% |
| Range | 6.0% | 4.8% |
| Mean | 2.6% | 2.1% |
| Median | 2.6% | 2.2% |
| Interquartile 25% (IQ1) | 2.2% | 1.6% |
| Interquartile 75% (IQ3) | 2.9% | 2.5% |
| Interquartile Range (IQR) | 0.76% | 0.89% |
| Standard Deviation (Sample) | 1.1% | 0.85% |
| Standard Deviation (Population) | 1.1% | 0.84% |
Demographics Similar to Belizeans and Immigrants from the Azores by Vision Disability
In terms of vision disability, the demographic groups most similar to Belizeans are White/Caucasian (2.4%, a difference of 0.17%), British West Indian (2.4%, a difference of 0.18%), West Indian (2.4%, a difference of 0.21%), Fijian (2.4%, a difference of 0.21%), and Jamaican (2.4%, a difference of 0.24%). Similarly, the demographic groups most similar to Immigrants from the Azores are Spaniard (2.4%, a difference of 0.10%), Celtic (2.4%, a difference of 0.16%), Cuban (2.4%, a difference of 0.16%), Immigrants from Bahamas (2.4%, a difference of 0.43%), and Senegalese (2.4%, a difference of 0.44%).
| Demographics | Rating | Rank | Vision Disability |
| Immigrants | Guatemala | 0.3 /100 | #255 | Tragic 2.4% |
| Immigrants | Haiti | 0.2 /100 | #256 | Tragic 2.4% |
| West Indians | 0.2 /100 | #257 | Tragic 2.4% |
| British West Indians | 0.2 /100 | #258 | Tragic 2.4% |
| Whites/Caucasians | 0.2 /100 | #259 | Tragic 2.4% |
| Belizeans | 0.2 /100 | #260 | Tragic 2.4% |
| Fijians | 0.1 /100 | #261 | Tragic 2.4% |
| Jamaicans | 0.1 /100 | #262 | Tragic 2.4% |
| Immigrants | Belize | 0.1 /100 | #263 | Tragic 2.4% |
| Immigrants | Liberia | 0.1 /100 | #264 | Tragic 2.4% |
| Immigrants | Jamaica | 0.1 /100 | #265 | Tragic 2.4% |
| Mexican American Indians | 0.1 /100 | #266 | Tragic 2.4% |
| Ute | 0.1 /100 | #267 | Tragic 2.4% |
| Senegalese | 0.1 /100 | #268 | Tragic 2.4% |
| Celtics | 0.1 /100 | #269 | Tragic 2.4% |
| Cubans | 0.1 /100 | #270 | Tragic 2.4% |
| Immigrants | Azores | 0.1 /100 | #271 | Tragic 2.4% |
| Spaniards | 0.1 /100 | #272 | Tragic 2.4% |
| Immigrants | Bahamas | 0.1 /100 | #273 | Tragic 2.4% |
| Immigrants | Latin America | 0.0 /100 | #274 | Tragic 2.4% |
| Chippewa | 0.0 /100 | #275 | Tragic 2.4% |