Cree vs Nicaraguan Vision Disability
COMPARE
Cree
Nicaraguan
Vision Disability
Vision Disability Comparison
Cree
Nicaraguans
2.5%
VISION DISABILITY
0.0/ 100
METRIC RATING
299th/ 347
METRIC RANK
2.3%
VISION DISABILITY
2.2/ 100
METRIC RATING
230th/ 347
METRIC RANK
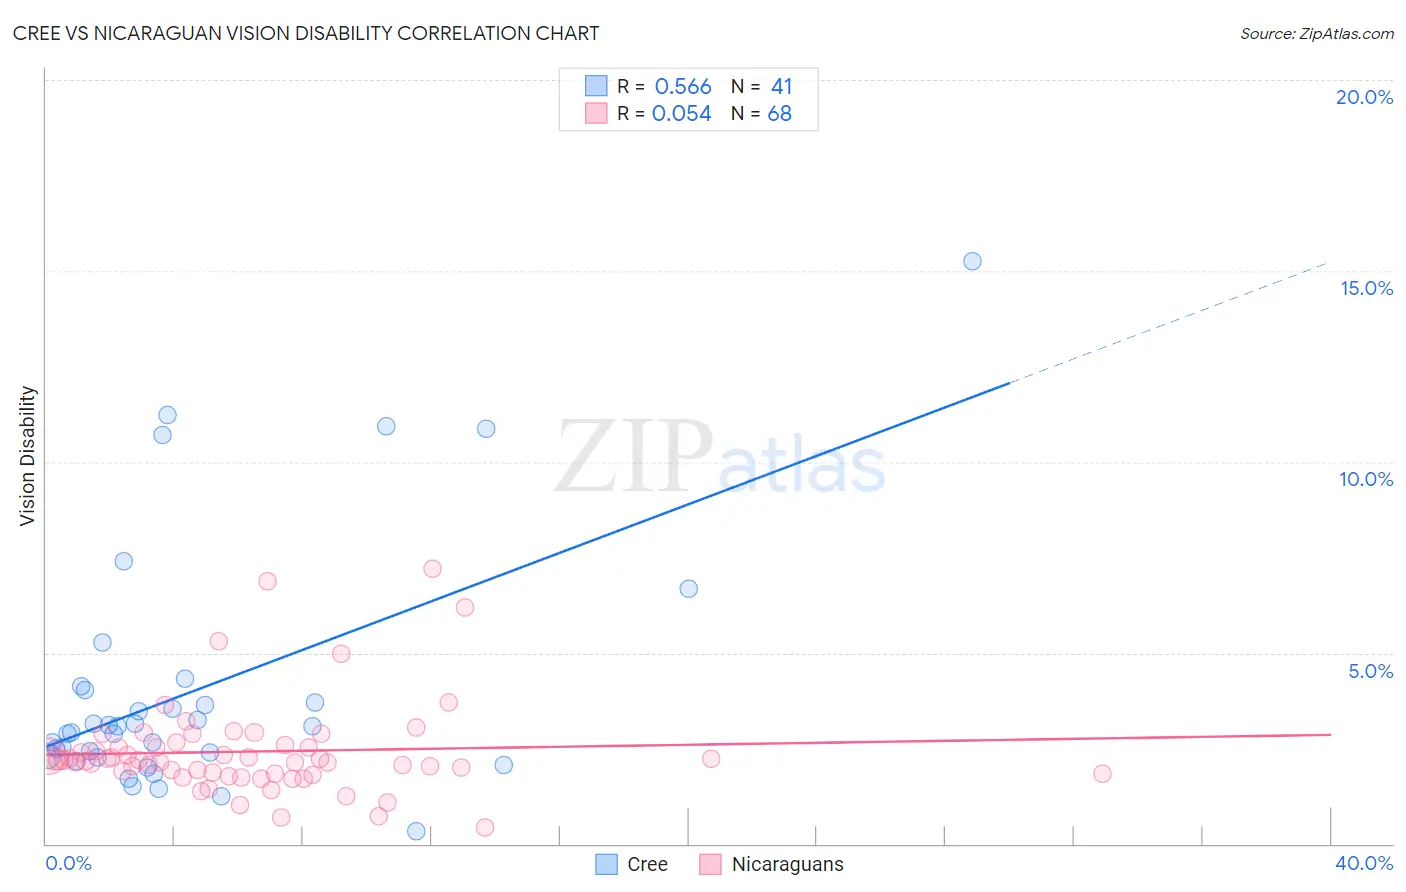
Cree vs Nicaraguan Vision Disability Correlation Chart
The statistical analysis conducted on geographies consisting of 76,198,383 people shows a substantial positive correlation between the proportion of Cree and percentage of population with vision disability in the United States with a correlation coefficient (R) of 0.566 and weighted average of 2.5%. Similarly, the statistical analysis conducted on geographies consisting of 285,594,144 people shows a slight positive correlation between the proportion of Nicaraguans and percentage of population with vision disability in the United States with a correlation coefficient (R) of 0.054 and weighted average of 2.3%, a difference of 10.4%.
Vision Disability Correlation Summary
| Measurement | Cree | Nicaraguan |
| Minimum | 0.32% | 0.44% |
| Maximum | 15.3% | 7.2% |
| Range | 14.9% | 6.8% |
| Mean | 4.1% | 2.4% |
| Median | 3.1% | 2.2% |
| Interquartile 25% (IQ1) | 2.3% | 1.8% |
| Interquartile 75% (IQ3) | 4.1% | 2.6% |
| Interquartile Range (IQR) | 1.8% | 0.73% |
| Standard Deviation (Sample) | 3.2% | 1.2% |
| Standard Deviation (Population) | 3.2% | 1.2% |
Similar Demographics by Vision Disability
Demographics Similar to Cree by Vision Disability
In terms of vision disability, the demographic groups most similar to Cree are Mexican (2.5%, a difference of 0.040%), Immigrants from Dominica (2.5%, a difference of 0.17%), African (2.5%, a difference of 0.20%), Menominee (2.5%, a difference of 0.38%), and Immigrants from Mexico (2.5%, a difference of 0.86%).
| Demographics | Rating | Rank | Vision Disability |
| Crow | 0.0 /100 | #292 | Tragic 2.5% |
| Yaqui | 0.0 /100 | #293 | Tragic 2.5% |
| Ottawa | 0.0 /100 | #294 | Tragic 2.5% |
| Delaware | 0.0 /100 | #295 | Tragic 2.5% |
| Immigrants | Mexico | 0.0 /100 | #296 | Tragic 2.5% |
| Immigrants | Dominica | 0.0 /100 | #297 | Tragic 2.5% |
| Mexicans | 0.0 /100 | #298 | Tragic 2.5% |
| Cree | 0.0 /100 | #299 | Tragic 2.5% |
| Africans | 0.0 /100 | #300 | Tragic 2.5% |
| Menominee | 0.0 /100 | #301 | Tragic 2.5% |
| Spanish American Indians | 0.0 /100 | #302 | Tragic 2.6% |
| Immigrants | Cabo Verde | 0.0 /100 | #303 | Tragic 2.6% |
| Aleuts | 0.0 /100 | #304 | Tragic 2.6% |
| Hispanics or Latinos | 0.0 /100 | #305 | Tragic 2.6% |
| Iroquois | 0.0 /100 | #306 | Tragic 2.6% |
Demographics Similar to Nicaraguans by Vision Disability
In terms of vision disability, the demographic groups most similar to Nicaraguans are Welsh (2.3%, a difference of 0.070%), Hmong (2.3%, a difference of 0.15%), Immigrants from Ecuador (2.3%, a difference of 0.16%), German Russian (2.3%, a difference of 0.35%), and Central American (2.3%, a difference of 0.36%).
| Demographics | Rating | Rank | Vision Disability |
| Basques | 3.5 /100 | #223 | Tragic 2.3% |
| Irish | 3.4 /100 | #224 | Tragic 2.3% |
| Immigrants | Western Africa | 3.4 /100 | #225 | Tragic 2.3% |
| Immigrants | Germany | 3.0 /100 | #226 | Tragic 2.3% |
| Hawaiians | 2.9 /100 | #227 | Tragic 2.3% |
| Hmong | 2.5 /100 | #228 | Tragic 2.3% |
| Welsh | 2.3 /100 | #229 | Tragic 2.3% |
| Nicaraguans | 2.2 /100 | #230 | Tragic 2.3% |
| Immigrants | Ecuador | 2.0 /100 | #231 | Tragic 2.3% |
| German Russians | 1.8 /100 | #232 | Tragic 2.3% |
| Central Americans | 1.8 /100 | #233 | Tragic 2.3% |
| Scottish | 1.6 /100 | #234 | Tragic 2.3% |
| Marshallese | 1.5 /100 | #235 | Tragic 2.3% |
| Immigrants | Congo | 1.4 /100 | #236 | Tragic 2.3% |
| Immigrants | Portugal | 1.4 /100 | #237 | Tragic 2.3% |