Cree vs Immigrants from Iraq Vision Disability
COMPARE
Cree
Immigrants from Iraq
Vision Disability
Vision Disability Comparison
Cree
Immigrants from Iraq
2.5%
VISION DISABILITY
0.0/ 100
METRIC RATING
299th/ 347
METRIC RANK
2.1%
VISION DISABILITY
64.8/ 100
METRIC RATING
165th/ 347
METRIC RANK
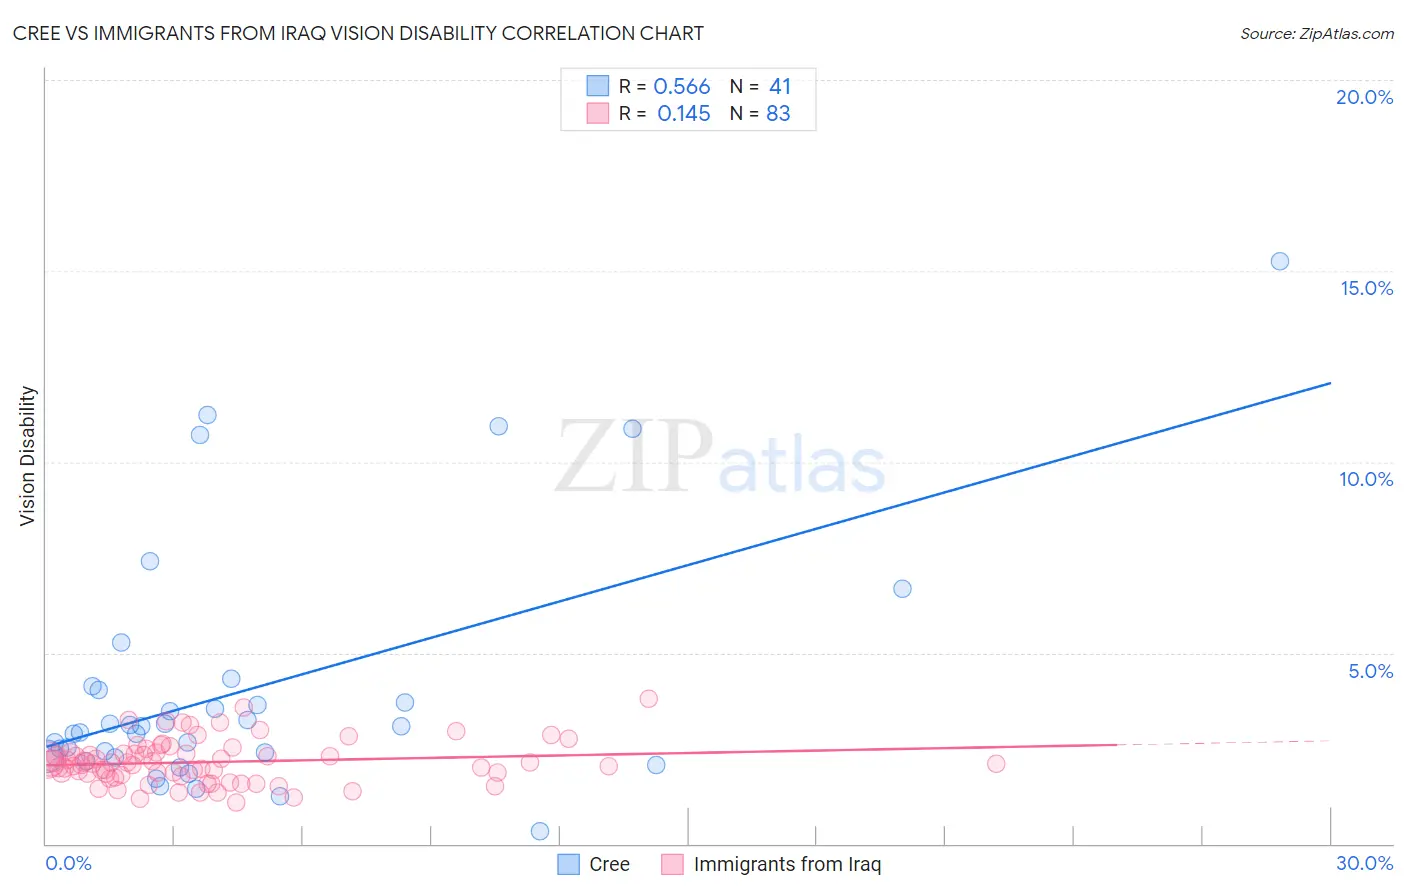
Cree vs Immigrants from Iraq Vision Disability Correlation Chart
The statistical analysis conducted on geographies consisting of 76,198,383 people shows a substantial positive correlation between the proportion of Cree and percentage of population with vision disability in the United States with a correlation coefficient (R) of 0.566 and weighted average of 2.5%. Similarly, the statistical analysis conducted on geographies consisting of 194,736,421 people shows a poor positive correlation between the proportion of Immigrants from Iraq and percentage of population with vision disability in the United States with a correlation coefficient (R) of 0.145 and weighted average of 2.1%, a difference of 18.1%.
Vision Disability Correlation Summary
| Measurement | Cree | Immigrants from Iraq |
| Minimum | 0.32% | 1.1% |
| Maximum | 15.3% | 3.8% |
| Range | 14.9% | 2.7% |
| Mean | 4.1% | 2.1% |
| Median | 3.1% | 2.1% |
| Interquartile 25% (IQ1) | 2.3% | 1.8% |
| Interquartile 75% (IQ3) | 4.1% | 2.4% |
| Interquartile Range (IQR) | 1.8% | 0.58% |
| Standard Deviation (Sample) | 3.2% | 0.56% |
| Standard Deviation (Population) | 3.2% | 0.56% |
Similar Demographics by Vision Disability
Demographics Similar to Cree by Vision Disability
In terms of vision disability, the demographic groups most similar to Cree are Mexican (2.5%, a difference of 0.040%), Immigrants from Dominica (2.5%, a difference of 0.17%), African (2.5%, a difference of 0.20%), Menominee (2.5%, a difference of 0.38%), and Immigrants from Mexico (2.5%, a difference of 0.86%).
| Demographics | Rating | Rank | Vision Disability |
| Crow | 0.0 /100 | #292 | Tragic 2.5% |
| Yaqui | 0.0 /100 | #293 | Tragic 2.5% |
| Ottawa | 0.0 /100 | #294 | Tragic 2.5% |
| Delaware | 0.0 /100 | #295 | Tragic 2.5% |
| Immigrants | Mexico | 0.0 /100 | #296 | Tragic 2.5% |
| Immigrants | Dominica | 0.0 /100 | #297 | Tragic 2.5% |
| Mexicans | 0.0 /100 | #298 | Tragic 2.5% |
| Cree | 0.0 /100 | #299 | Tragic 2.5% |
| Africans | 0.0 /100 | #300 | Tragic 2.5% |
| Menominee | 0.0 /100 | #301 | Tragic 2.5% |
| Spanish American Indians | 0.0 /100 | #302 | Tragic 2.6% |
| Immigrants | Cabo Verde | 0.0 /100 | #303 | Tragic 2.6% |
| Aleuts | 0.0 /100 | #304 | Tragic 2.6% |
| Hispanics or Latinos | 0.0 /100 | #305 | Tragic 2.6% |
| Iroquois | 0.0 /100 | #306 | Tragic 2.6% |
Demographics Similar to Immigrants from Iraq by Vision Disability
In terms of vision disability, the demographic groups most similar to Immigrants from Iraq are Immigrants from Bangladesh (2.1%, a difference of 0.050%), Icelander (2.1%, a difference of 0.090%), Immigrants from England (2.1%, a difference of 0.14%), Immigrants from Africa (2.1%, a difference of 0.15%), and Hungarian (2.1%, a difference of 0.18%).
| Demographics | Rating | Rank | Vision Disability |
| Immigrants | Uzbekistan | 69.9 /100 | #158 | Good 2.1% |
| South Africans | 69.8 /100 | #159 | Good 2.1% |
| Austrians | 69.0 /100 | #160 | Good 2.1% |
| Iraqis | 67.7 /100 | #161 | Good 2.1% |
| Hungarians | 67.4 /100 | #162 | Good 2.1% |
| Icelanders | 66.1 /100 | #163 | Good 2.1% |
| Immigrants | Bangladesh | 65.5 /100 | #164 | Good 2.1% |
| Immigrants | Iraq | 64.8 /100 | #165 | Good 2.1% |
| Immigrants | England | 62.8 /100 | #166 | Good 2.1% |
| Immigrants | Africa | 62.6 /100 | #167 | Good 2.1% |
| Brazilians | 62.2 /100 | #168 | Good 2.1% |
| South American Indians | 57.4 /100 | #169 | Average 2.2% |
| Swiss | 55.7 /100 | #170 | Average 2.2% |
| Lebanese | 54.3 /100 | #171 | Average 2.2% |
| Northern Europeans | 50.1 /100 | #172 | Average 2.2% |