Cuban vs Immigrants from the Azores Vision Disability
COMPARE
Cuban
Immigrants from the Azores
Vision Disability
Vision Disability Comparison
Cubans
Immigrants from the Azores
2.4%
VISION DISABILITY
0.1/ 100
METRIC RATING
270th/ 347
METRIC RANK
2.4%
VISION DISABILITY
0.1/ 100
METRIC RATING
271st/ 347
METRIC RANK
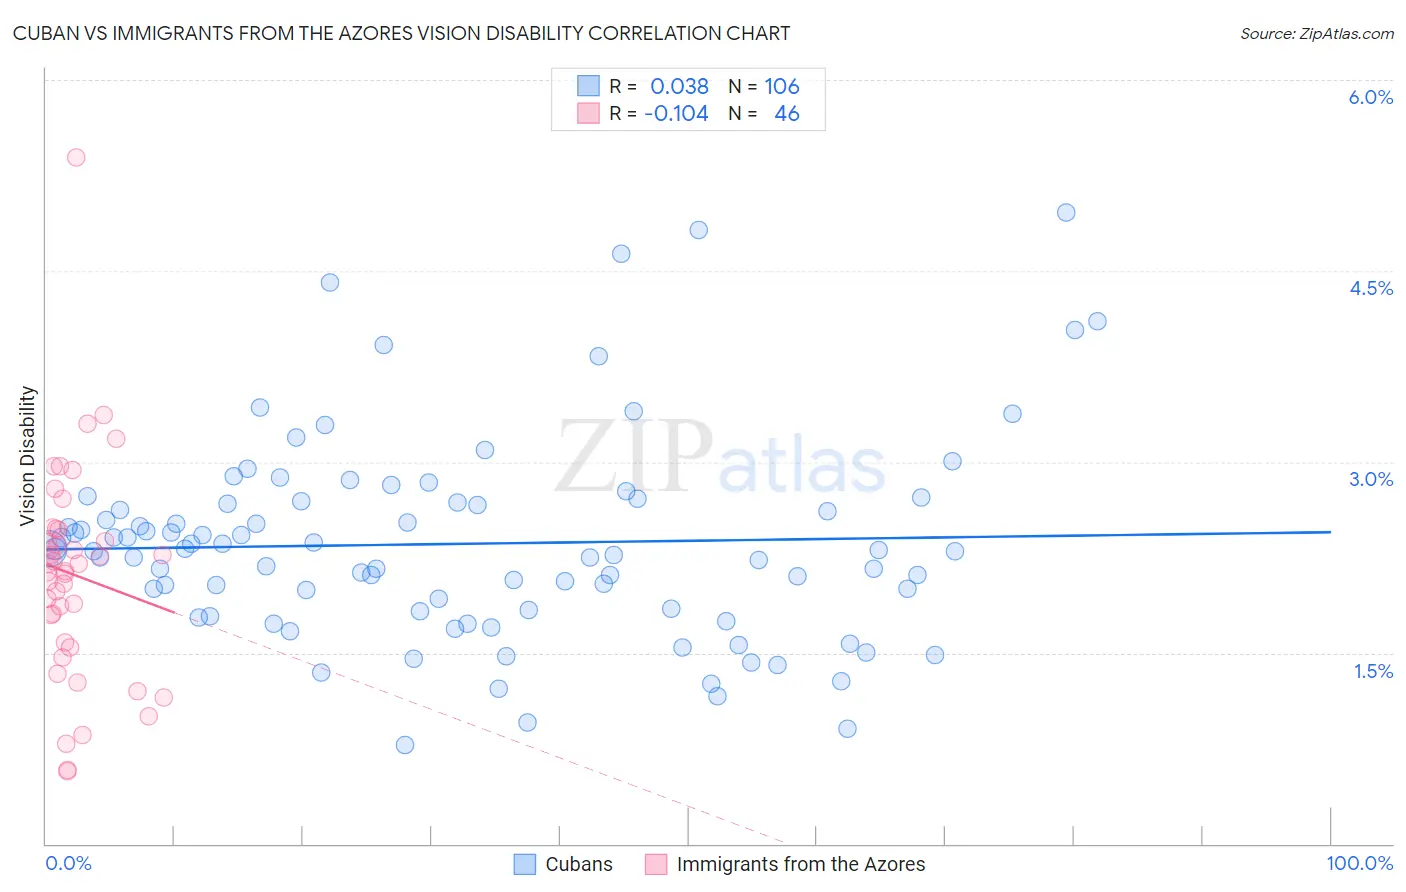
Cuban vs Immigrants from the Azores Vision Disability Correlation Chart
The statistical analysis conducted on geographies consisting of 448,885,451 people shows no correlation between the proportion of Cubans and percentage of population with vision disability in the United States with a correlation coefficient (R) of 0.038 and weighted average of 2.4%. Similarly, the statistical analysis conducted on geographies consisting of 46,255,686 people shows a poor negative correlation between the proportion of Immigrants from the Azores and percentage of population with vision disability in the United States with a correlation coefficient (R) of -0.104 and weighted average of 2.4%, a difference of 0.16%.
Vision Disability Correlation Summary
| Measurement | Cuban | Immigrants from the Azores |
| Minimum | 0.77% | 0.57% |
| Maximum | 5.0% | 5.4% |
| Range | 4.2% | 4.8% |
| Mean | 2.4% | 2.1% |
| Median | 2.3% | 2.2% |
| Interquartile 25% (IQ1) | 1.8% | 1.6% |
| Interquartile 75% (IQ3) | 2.7% | 2.5% |
| Interquartile Range (IQR) | 0.85% | 0.89% |
| Standard Deviation (Sample) | 0.80% | 0.85% |
| Standard Deviation (Population) | 0.79% | 0.84% |
Demographics Similar to Cubans and Immigrants from the Azores by Vision Disability
In terms of vision disability, the demographic groups most similar to Cubans are Celtic (2.4%, a difference of 0.010%), Spaniard (2.4%, a difference of 0.26%), Senegalese (2.4%, a difference of 0.28%), Ute (2.4%, a difference of 0.37%), and Mexican American Indian (2.4%, a difference of 0.38%). Similarly, the demographic groups most similar to Immigrants from the Azores are Spaniard (2.4%, a difference of 0.10%), Celtic (2.4%, a difference of 0.16%), Immigrants from Bahamas (2.4%, a difference of 0.43%), Senegalese (2.4%, a difference of 0.44%), and Ute (2.4%, a difference of 0.52%).
| Demographics | Rating | Rank | Vision Disability |
| Belizeans | 0.2 /100 | #260 | Tragic 2.4% |
| Fijians | 0.1 /100 | #261 | Tragic 2.4% |
| Jamaicans | 0.1 /100 | #262 | Tragic 2.4% |
| Immigrants | Belize | 0.1 /100 | #263 | Tragic 2.4% |
| Immigrants | Liberia | 0.1 /100 | #264 | Tragic 2.4% |
| Immigrants | Jamaica | 0.1 /100 | #265 | Tragic 2.4% |
| Mexican American Indians | 0.1 /100 | #266 | Tragic 2.4% |
| Ute | 0.1 /100 | #267 | Tragic 2.4% |
| Senegalese | 0.1 /100 | #268 | Tragic 2.4% |
| Celtics | 0.1 /100 | #269 | Tragic 2.4% |
| Cubans | 0.1 /100 | #270 | Tragic 2.4% |
| Immigrants | Azores | 0.1 /100 | #271 | Tragic 2.4% |
| Spaniards | 0.1 /100 | #272 | Tragic 2.4% |
| Immigrants | Bahamas | 0.1 /100 | #273 | Tragic 2.4% |
| Immigrants | Latin America | 0.0 /100 | #274 | Tragic 2.4% |
| Chippewa | 0.0 /100 | #275 | Tragic 2.4% |
| Scotch-Irish | 0.0 /100 | #276 | Tragic 2.4% |
| Bahamians | 0.0 /100 | #277 | Tragic 2.4% |
| Spanish | 0.0 /100 | #278 | Tragic 2.4% |
| Nepalese | 0.0 /100 | #279 | Tragic 2.4% |
| Cape Verdeans | 0.0 /100 | #280 | Tragic 2.4% |