Burmese vs Immigrants from the Azores Vision Disability
COMPARE
Burmese
Immigrants from the Azores
Vision Disability
Vision Disability Comparison
Burmese
Immigrants from the Azores
1.8%
VISION DISABILITY
100.0/ 100
METRIC RATING
17th/ 347
METRIC RANK
2.4%
VISION DISABILITY
0.1/ 100
METRIC RATING
271st/ 347
METRIC RANK
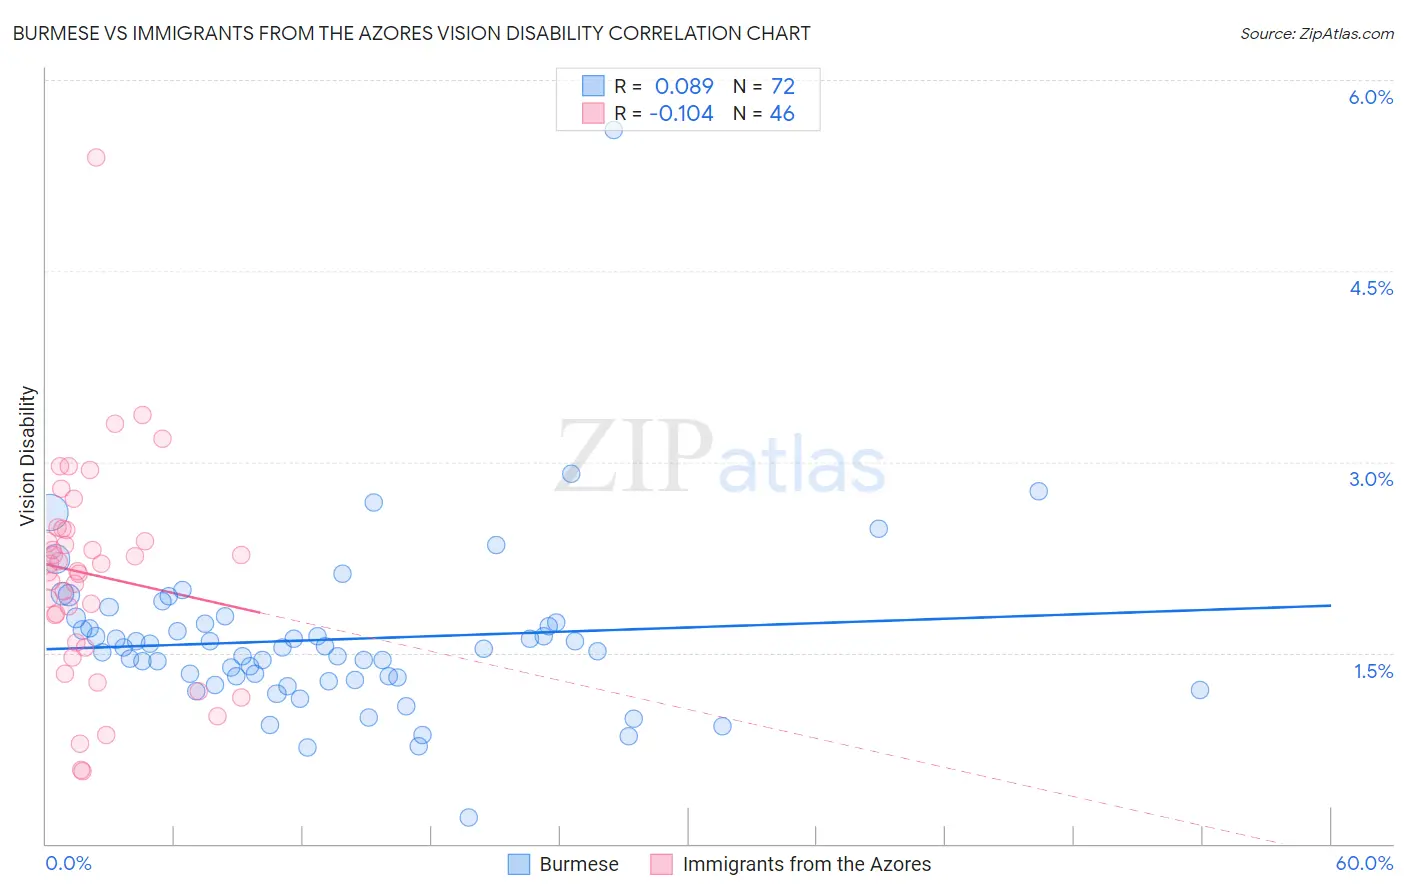
Burmese vs Immigrants from the Azores Vision Disability Correlation Chart
The statistical analysis conducted on geographies consisting of 464,767,032 people shows a slight positive correlation between the proportion of Burmese and percentage of population with vision disability in the United States with a correlation coefficient (R) of 0.089 and weighted average of 1.8%. Similarly, the statistical analysis conducted on geographies consisting of 46,255,686 people shows a poor negative correlation between the proportion of Immigrants from the Azores and percentage of population with vision disability in the United States with a correlation coefficient (R) of -0.104 and weighted average of 2.4%, a difference of 30.4%.
Vision Disability Correlation Summary
| Measurement | Burmese | Immigrants from the Azores |
| Minimum | 0.21% | 0.57% |
| Maximum | 5.6% | 5.4% |
| Range | 5.4% | 4.8% |
| Mean | 1.6% | 2.1% |
| Median | 1.5% | 2.2% |
| Interquartile 25% (IQ1) | 1.3% | 1.6% |
| Interquartile 75% (IQ3) | 1.7% | 2.5% |
| Interquartile Range (IQR) | 0.43% | 0.89% |
| Standard Deviation (Sample) | 0.68% | 0.85% |
| Standard Deviation (Population) | 0.67% | 0.84% |
Similar Demographics by Vision Disability
Demographics Similar to Burmese by Vision Disability
In terms of vision disability, the demographic groups most similar to Burmese are Indian (Asian) (1.8%, a difference of 0.010%), Bolivian (1.9%, a difference of 0.42%), Immigrants from Bolivia (1.8%, a difference of 0.45%), Immigrants from China (1.8%, a difference of 0.87%), and Immigrants from Eastern Asia (1.8%, a difference of 1.0%).
| Demographics | Rating | Rank | Vision Disability |
| Immigrants | Hong Kong | 100.0 /100 | #10 | Exceptional 1.8% |
| Immigrants | Israel | 100.0 /100 | #11 | Exceptional 1.8% |
| Immigrants | Korea | 100.0 /100 | #12 | Exceptional 1.8% |
| Immigrants | Eastern Asia | 100.0 /100 | #13 | Exceptional 1.8% |
| Immigrants | China | 100.0 /100 | #14 | Exceptional 1.8% |
| Immigrants | Bolivia | 100.0 /100 | #15 | Exceptional 1.8% |
| Indians (Asian) | 100.0 /100 | #16 | Exceptional 1.8% |
| Burmese | 100.0 /100 | #17 | Exceptional 1.8% |
| Bolivians | 100.0 /100 | #18 | Exceptional 1.9% |
| Immigrants | Sri Lanka | 100.0 /100 | #19 | Exceptional 1.9% |
| Asians | 100.0 /100 | #20 | Exceptional 1.9% |
| Turks | 100.0 /100 | #21 | Exceptional 1.9% |
| Immigrants | Pakistan | 100.0 /100 | #22 | Exceptional 1.9% |
| Immigrants | Asia | 99.9 /100 | #23 | Exceptional 1.9% |
| Immigrants | Lithuania | 99.9 /100 | #24 | Exceptional 1.9% |
Demographics Similar to Immigrants from the Azores by Vision Disability
In terms of vision disability, the demographic groups most similar to Immigrants from the Azores are Spaniard (2.4%, a difference of 0.10%), Celtic (2.4%, a difference of 0.16%), Cuban (2.4%, a difference of 0.16%), Immigrants from Bahamas (2.4%, a difference of 0.43%), and Senegalese (2.4%, a difference of 0.44%).
| Demographics | Rating | Rank | Vision Disability |
| Immigrants | Liberia | 0.1 /100 | #264 | Tragic 2.4% |
| Immigrants | Jamaica | 0.1 /100 | #265 | Tragic 2.4% |
| Mexican American Indians | 0.1 /100 | #266 | Tragic 2.4% |
| Ute | 0.1 /100 | #267 | Tragic 2.4% |
| Senegalese | 0.1 /100 | #268 | Tragic 2.4% |
| Celtics | 0.1 /100 | #269 | Tragic 2.4% |
| Cubans | 0.1 /100 | #270 | Tragic 2.4% |
| Immigrants | Azores | 0.1 /100 | #271 | Tragic 2.4% |
| Spaniards | 0.1 /100 | #272 | Tragic 2.4% |
| Immigrants | Bahamas | 0.1 /100 | #273 | Tragic 2.4% |
| Immigrants | Latin America | 0.0 /100 | #274 | Tragic 2.4% |
| Chippewa | 0.0 /100 | #275 | Tragic 2.4% |
| Scotch-Irish | 0.0 /100 | #276 | Tragic 2.4% |
| Bahamians | 0.0 /100 | #277 | Tragic 2.4% |
| Spanish | 0.0 /100 | #278 | Tragic 2.4% |