Cree vs Immigrants from Switzerland Vision Disability
COMPARE
Cree
Immigrants from Switzerland
Vision Disability
Vision Disability Comparison
Cree
Immigrants from Switzerland
2.5%
VISION DISABILITY
0.0/ 100
METRIC RATING
299th/ 347
METRIC RANK
2.0%
VISION DISABILITY
97.0/ 100
METRIC RATING
87th/ 347
METRIC RANK
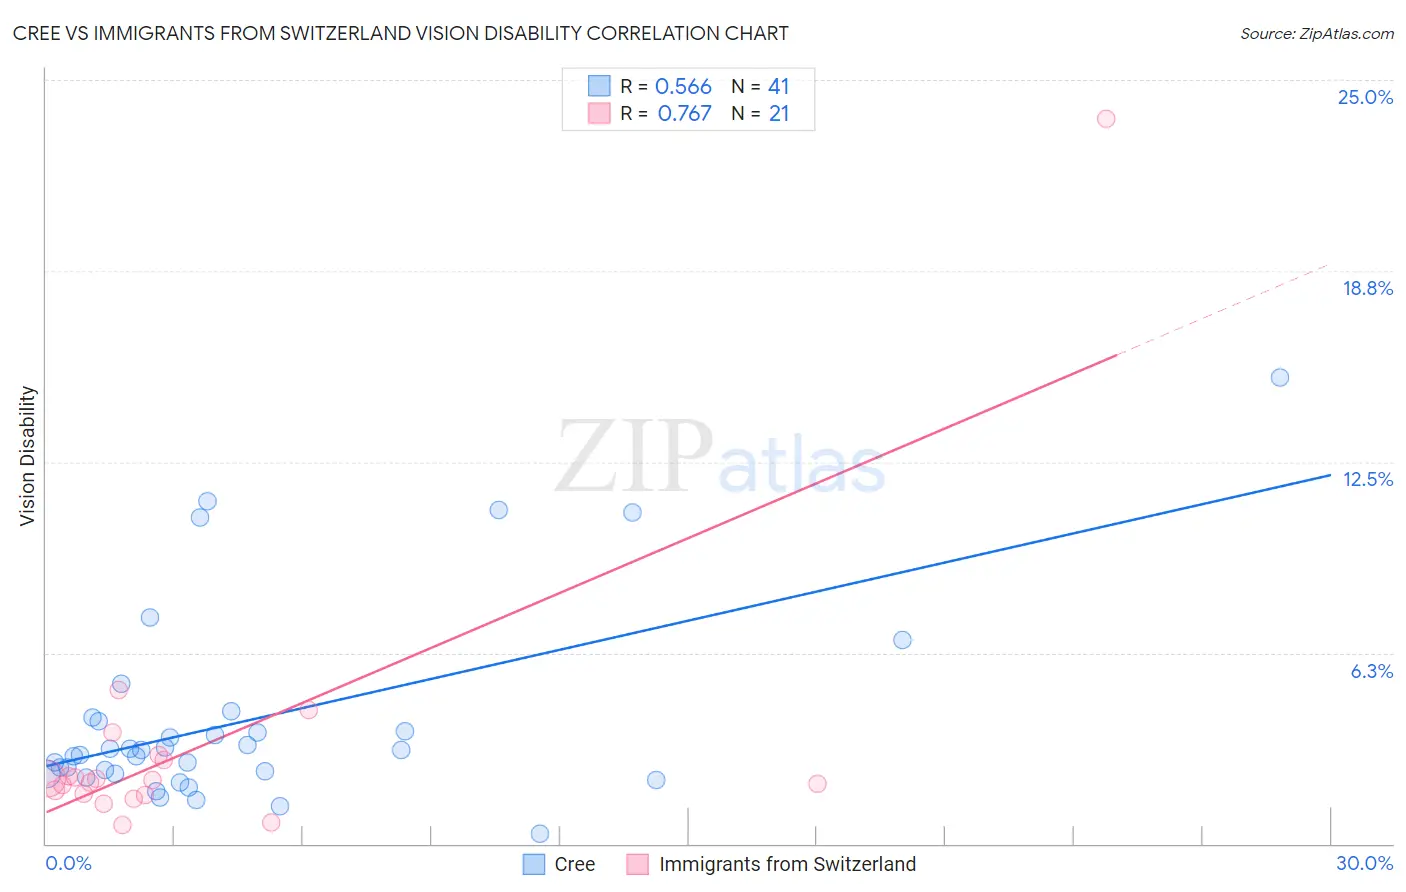
Cree vs Immigrants from Switzerland Vision Disability Correlation Chart
The statistical analysis conducted on geographies consisting of 76,198,383 people shows a substantial positive correlation between the proportion of Cree and percentage of population with vision disability in the United States with a correlation coefficient (R) of 0.566 and weighted average of 2.5%. Similarly, the statistical analysis conducted on geographies consisting of 148,059,339 people shows a strong positive correlation between the proportion of Immigrants from Switzerland and percentage of population with vision disability in the United States with a correlation coefficient (R) of 0.767 and weighted average of 2.0%, a difference of 23.8%.
Vision Disability Correlation Summary
| Measurement | Cree | Immigrants from Switzerland |
| Minimum | 0.32% | 0.59% |
| Maximum | 15.3% | 23.7% |
| Range | 14.9% | 23.1% |
| Mean | 4.1% | 3.2% |
| Median | 3.1% | 2.1% |
| Interquartile 25% (IQ1) | 2.3% | 1.6% |
| Interquartile 75% (IQ3) | 4.1% | 2.8% |
| Interquartile Range (IQR) | 1.8% | 1.2% |
| Standard Deviation (Sample) | 3.2% | 4.8% |
| Standard Deviation (Population) | 3.2% | 4.7% |
Similar Demographics by Vision Disability
Demographics Similar to Cree by Vision Disability
In terms of vision disability, the demographic groups most similar to Cree are Mexican (2.5%, a difference of 0.040%), Immigrants from Dominica (2.5%, a difference of 0.17%), African (2.5%, a difference of 0.20%), Menominee (2.5%, a difference of 0.38%), and Immigrants from Mexico (2.5%, a difference of 0.86%).
| Demographics | Rating | Rank | Vision Disability |
| Crow | 0.0 /100 | #292 | Tragic 2.5% |
| Yaqui | 0.0 /100 | #293 | Tragic 2.5% |
| Ottawa | 0.0 /100 | #294 | Tragic 2.5% |
| Delaware | 0.0 /100 | #295 | Tragic 2.5% |
| Immigrants | Mexico | 0.0 /100 | #296 | Tragic 2.5% |
| Immigrants | Dominica | 0.0 /100 | #297 | Tragic 2.5% |
| Mexicans | 0.0 /100 | #298 | Tragic 2.5% |
| Cree | 0.0 /100 | #299 | Tragic 2.5% |
| Africans | 0.0 /100 | #300 | Tragic 2.5% |
| Menominee | 0.0 /100 | #301 | Tragic 2.5% |
| Spanish American Indians | 0.0 /100 | #302 | Tragic 2.6% |
| Immigrants | Cabo Verde | 0.0 /100 | #303 | Tragic 2.6% |
| Aleuts | 0.0 /100 | #304 | Tragic 2.6% |
| Hispanics or Latinos | 0.0 /100 | #305 | Tragic 2.6% |
| Iroquois | 0.0 /100 | #306 | Tragic 2.6% |
Demographics Similar to Immigrants from Switzerland by Vision Disability
In terms of vision disability, the demographic groups most similar to Immigrants from Switzerland are Norwegian (2.0%, a difference of 0.010%), Immigrants from Eastern Africa (2.0%, a difference of 0.050%), Immigrants from Moldova (2.0%, a difference of 0.060%), Chinese (2.0%, a difference of 0.090%), and Immigrants from Latvia (2.0%, a difference of 0.14%).
| Demographics | Rating | Rank | Vision Disability |
| Lithuanians | 97.7 /100 | #80 | Exceptional 2.0% |
| Soviet Union | 97.6 /100 | #81 | Exceptional 2.0% |
| Immigrants | Poland | 97.6 /100 | #82 | Exceptional 2.0% |
| Immigrants | Western Asia | 97.5 /100 | #83 | Exceptional 2.0% |
| Immigrants | Latvia | 97.3 /100 | #84 | Exceptional 2.0% |
| Chinese | 97.2 /100 | #85 | Exceptional 2.0% |
| Immigrants | Moldova | 97.2 /100 | #86 | Exceptional 2.0% |
| Immigrants | Switzerland | 97.0 /100 | #87 | Exceptional 2.0% |
| Norwegians | 97.0 /100 | #88 | Exceptional 2.0% |
| Immigrants | Eastern Africa | 97.0 /100 | #89 | Exceptional 2.0% |
| Immigrants | Lebanon | 96.7 /100 | #90 | Exceptional 2.1% |
| Immigrants | Somalia | 96.2 /100 | #91 | Exceptional 2.1% |
| Immigrants | Syria | 96.2 /100 | #92 | Exceptional 2.1% |
| Immigrants | Europe | 96.1 /100 | #93 | Exceptional 2.1% |
| Immigrants | Croatia | 96.0 /100 | #94 | Exceptional 2.1% |