Cree vs Immigrants from South Africa Vision Disability
COMPARE
Cree
Immigrants from South Africa
Vision Disability
Vision Disability Comparison
Cree
Immigrants from South Africa
2.5%
VISION DISABILITY
0.0/ 100
METRIC RATING
299th/ 347
METRIC RANK
2.1%
VISION DISABILITY
95.4/ 100
METRIC RATING
98th/ 347
METRIC RANK
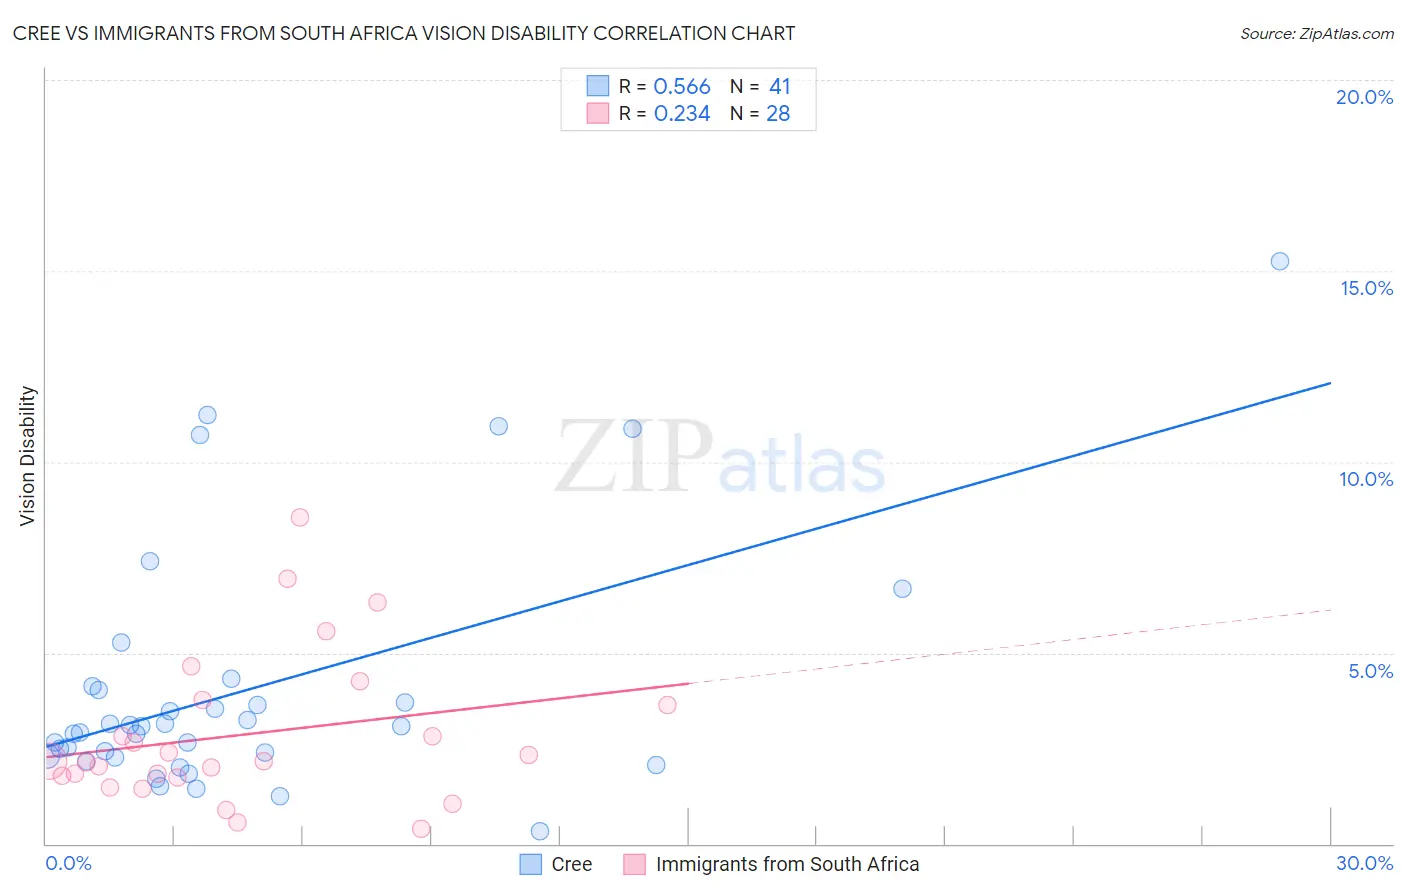
Cree vs Immigrants from South Africa Vision Disability Correlation Chart
The statistical analysis conducted on geographies consisting of 76,198,383 people shows a substantial positive correlation between the proportion of Cree and percentage of population with vision disability in the United States with a correlation coefficient (R) of 0.566 and weighted average of 2.5%. Similarly, the statistical analysis conducted on geographies consisting of 233,222,881 people shows a weak positive correlation between the proportion of Immigrants from South Africa and percentage of population with vision disability in the United States with a correlation coefficient (R) of 0.234 and weighted average of 2.1%, a difference of 22.9%.
Vision Disability Correlation Summary
| Measurement | Cree | Immigrants from South Africa |
| Minimum | 0.32% | 0.40% |
| Maximum | 15.3% | 8.6% |
| Range | 14.9% | 8.2% |
| Mean | 4.1% | 2.9% |
| Median | 3.1% | 2.2% |
| Interquartile 25% (IQ1) | 2.3% | 1.8% |
| Interquartile 75% (IQ3) | 4.1% | 3.7% |
| Interquartile Range (IQR) | 1.8% | 1.9% |
| Standard Deviation (Sample) | 3.2% | 2.0% |
| Standard Deviation (Population) | 3.2% | 1.9% |
Similar Demographics by Vision Disability
Demographics Similar to Cree by Vision Disability
In terms of vision disability, the demographic groups most similar to Cree are Mexican (2.5%, a difference of 0.040%), Immigrants from Dominica (2.5%, a difference of 0.17%), African (2.5%, a difference of 0.20%), Menominee (2.5%, a difference of 0.38%), and Immigrants from Mexico (2.5%, a difference of 0.86%).
| Demographics | Rating | Rank | Vision Disability |
| Crow | 0.0 /100 | #292 | Tragic 2.5% |
| Yaqui | 0.0 /100 | #293 | Tragic 2.5% |
| Ottawa | 0.0 /100 | #294 | Tragic 2.5% |
| Delaware | 0.0 /100 | #295 | Tragic 2.5% |
| Immigrants | Mexico | 0.0 /100 | #296 | Tragic 2.5% |
| Immigrants | Dominica | 0.0 /100 | #297 | Tragic 2.5% |
| Mexicans | 0.0 /100 | #298 | Tragic 2.5% |
| Cree | 0.0 /100 | #299 | Tragic 2.5% |
| Africans | 0.0 /100 | #300 | Tragic 2.5% |
| Menominee | 0.0 /100 | #301 | Tragic 2.5% |
| Spanish American Indians | 0.0 /100 | #302 | Tragic 2.6% |
| Immigrants | Cabo Verde | 0.0 /100 | #303 | Tragic 2.6% |
| Aleuts | 0.0 /100 | #304 | Tragic 2.6% |
| Hispanics or Latinos | 0.0 /100 | #305 | Tragic 2.6% |
| Iroquois | 0.0 /100 | #306 | Tragic 2.6% |
Demographics Similar to Immigrants from South Africa by Vision Disability
In terms of vision disability, the demographic groups most similar to Immigrants from South Africa are Immigrants from Afghanistan (2.1%, a difference of 0.050%), Estonian (2.1%, a difference of 0.070%), Romanian (2.1%, a difference of 0.11%), Greek (2.1%, a difference of 0.11%), and Australian (2.1%, a difference of 0.17%).
| Demographics | Rating | Rank | Vision Disability |
| Immigrants | Somalia | 96.2 /100 | #91 | Exceptional 2.1% |
| Immigrants | Syria | 96.2 /100 | #92 | Exceptional 2.1% |
| Immigrants | Europe | 96.1 /100 | #93 | Exceptional 2.1% |
| Immigrants | Croatia | 96.0 /100 | #94 | Exceptional 2.1% |
| Australians | 95.9 /100 | #95 | Exceptional 2.1% |
| Romanians | 95.7 /100 | #96 | Exceptional 2.1% |
| Immigrants | Afghanistan | 95.6 /100 | #97 | Exceptional 2.1% |
| Immigrants | South Africa | 95.4 /100 | #98 | Exceptional 2.1% |
| Estonians | 95.3 /100 | #99 | Exceptional 2.1% |
| Greeks | 95.1 /100 | #100 | Exceptional 2.1% |
| Albanians | 94.9 /100 | #101 | Exceptional 2.1% |
| Sri Lankans | 94.8 /100 | #102 | Exceptional 2.1% |
| Immigrants | Austria | 94.4 /100 | #103 | Exceptional 2.1% |
| Immigrants | Italy | 94.4 /100 | #104 | Exceptional 2.1% |
| Carpatho Rusyns | 94.3 /100 | #105 | Exceptional 2.1% |