Cree vs Immigrants from North America Vision Disability
COMPARE
Cree
Immigrants from North America
Vision Disability
Vision Disability Comparison
Cree
Immigrants from North America
2.5%
VISION DISABILITY
0.0/ 100
METRIC RATING
299th/ 347
METRIC RANK
2.2%
VISION DISABILITY
44.5/ 100
METRIC RATING
179th/ 347
METRIC RANK
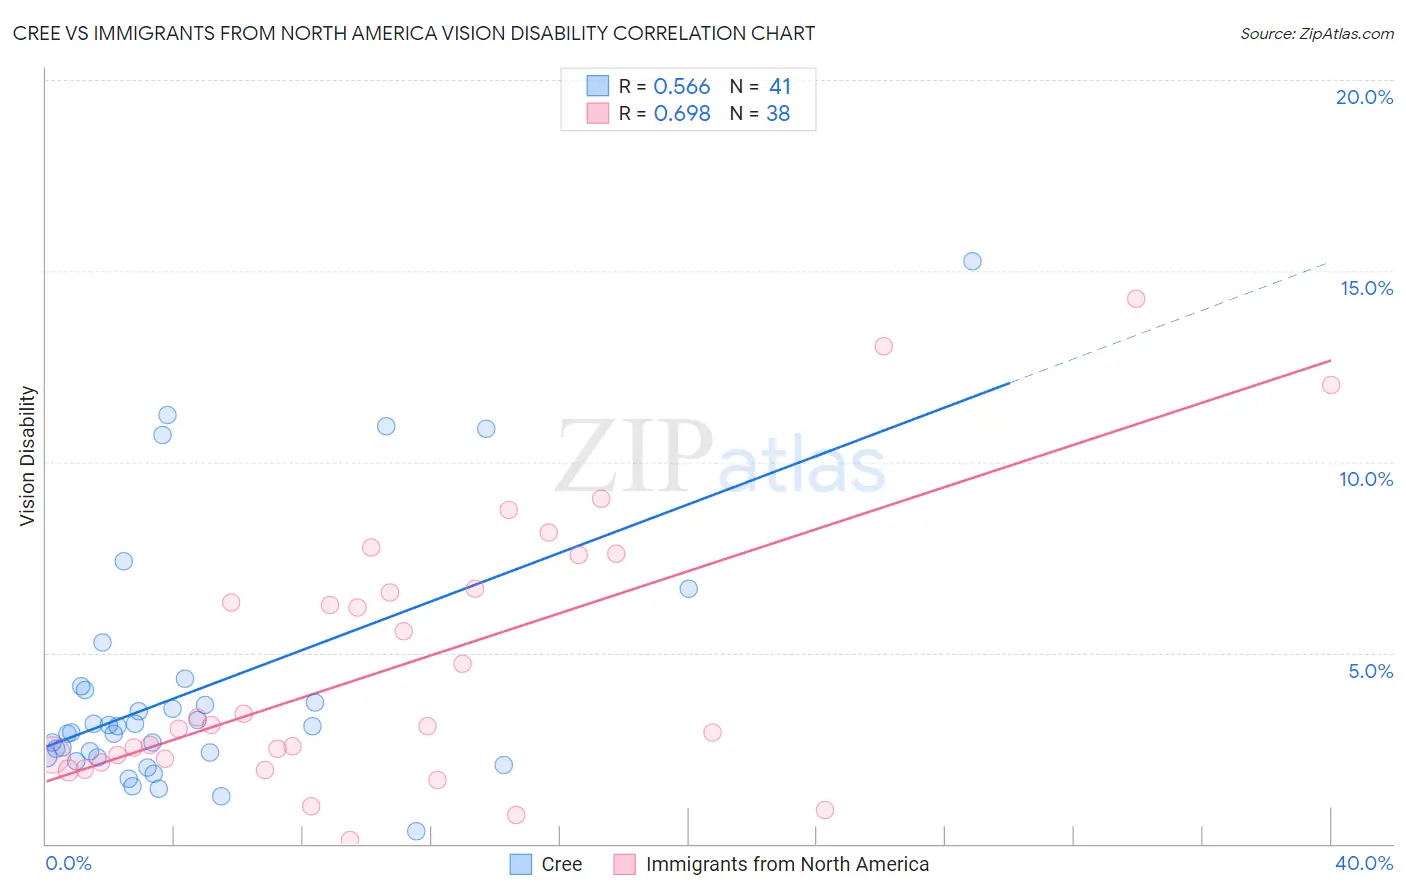
Cree vs Immigrants from North America Vision Disability Correlation Chart
The statistical analysis conducted on geographies consisting of 76,198,383 people shows a substantial positive correlation between the proportion of Cree and percentage of population with vision disability in the United States with a correlation coefficient (R) of 0.566 and weighted average of 2.5%. Similarly, the statistical analysis conducted on geographies consisting of 461,875,281 people shows a significant positive correlation between the proportion of Immigrants from North America and percentage of population with vision disability in the United States with a correlation coefficient (R) of 0.698 and weighted average of 2.2%, a difference of 16.6%.
Vision Disability Correlation Summary
| Measurement | Cree | Immigrants from North America |
| Minimum | 0.32% | 0.10% |
| Maximum | 15.3% | 14.3% |
| Range | 14.9% | 14.2% |
| Mean | 4.1% | 4.7% |
| Median | 3.1% | 3.1% |
| Interquartile 25% (IQ1) | 2.3% | 2.2% |
| Interquartile 75% (IQ3) | 4.1% | 6.7% |
| Interquartile Range (IQR) | 1.8% | 4.5% |
| Standard Deviation (Sample) | 3.2% | 3.5% |
| Standard Deviation (Population) | 3.2% | 3.5% |
Similar Demographics by Vision Disability
Demographics Similar to Cree by Vision Disability
In terms of vision disability, the demographic groups most similar to Cree are Mexican (2.5%, a difference of 0.040%), Immigrants from Dominica (2.5%, a difference of 0.17%), African (2.5%, a difference of 0.20%), Menominee (2.5%, a difference of 0.38%), and Immigrants from Mexico (2.5%, a difference of 0.86%).
| Demographics | Rating | Rank | Vision Disability |
| Crow | 0.0 /100 | #292 | Tragic 2.5% |
| Yaqui | 0.0 /100 | #293 | Tragic 2.5% |
| Ottawa | 0.0 /100 | #294 | Tragic 2.5% |
| Delaware | 0.0 /100 | #295 | Tragic 2.5% |
| Immigrants | Mexico | 0.0 /100 | #296 | Tragic 2.5% |
| Immigrants | Dominica | 0.0 /100 | #297 | Tragic 2.5% |
| Mexicans | 0.0 /100 | #298 | Tragic 2.5% |
| Cree | 0.0 /100 | #299 | Tragic 2.5% |
| Africans | 0.0 /100 | #300 | Tragic 2.5% |
| Menominee | 0.0 /100 | #301 | Tragic 2.5% |
| Spanish American Indians | 0.0 /100 | #302 | Tragic 2.6% |
| Immigrants | Cabo Verde | 0.0 /100 | #303 | Tragic 2.6% |
| Aleuts | 0.0 /100 | #304 | Tragic 2.6% |
| Hispanics or Latinos | 0.0 /100 | #305 | Tragic 2.6% |
| Iroquois | 0.0 /100 | #306 | Tragic 2.6% |
Demographics Similar to Immigrants from North America by Vision Disability
In terms of vision disability, the demographic groups most similar to Immigrants from North America are Immigrants from Oceania (2.2%, a difference of 0.040%), Slavic (2.2%, a difference of 0.090%), Uruguayan (2.2%, a difference of 0.12%), Yugoslavian (2.2%, a difference of 0.13%), and Immigrants from Fiji (2.2%, a difference of 0.20%).
| Demographics | Rating | Rank | Vision Disability |
| Northern Europeans | 50.1 /100 | #172 | Average 2.2% |
| Scandinavians | 50.0 /100 | #173 | Average 2.2% |
| Immigrants | Canada | 50.0 /100 | #174 | Average 2.2% |
| Immigrants | Fiji | 47.6 /100 | #175 | Average 2.2% |
| Yugoslavians | 46.5 /100 | #176 | Average 2.2% |
| Slavs | 46.0 /100 | #177 | Average 2.2% |
| Immigrants | Oceania | 45.1 /100 | #178 | Average 2.2% |
| Immigrants | North America | 44.5 /100 | #179 | Average 2.2% |
| Uruguayans | 42.7 /100 | #180 | Average 2.2% |
| Immigrants | Western Europe | 41.1 /100 | #181 | Average 2.2% |
| Costa Ricans | 40.7 /100 | #182 | Average 2.2% |
| Immigrants | Burma/Myanmar | 37.9 /100 | #183 | Fair 2.2% |
| Moroccans | 35.4 /100 | #184 | Fair 2.2% |
| Immigrants | Middle Africa | 33.5 /100 | #185 | Fair 2.2% |
| Native Hawaiians | 33.3 /100 | #186 | Fair 2.2% |