Comanche vs Hungarian Disability Age Under 5
COMPARE
Comanche
Hungarian
Disability Age Under 5
Disability Age Under 5 Comparison
Comanche
Hungarians
1.2%
DISABILITY AGE UNDER 5
47.5/ 100
METRIC RATING
177th/ 347
METRIC RANK
1.5%
DISABILITY AGE UNDER 5
0.0/ 100
METRIC RATING
289th/ 347
METRIC RANK
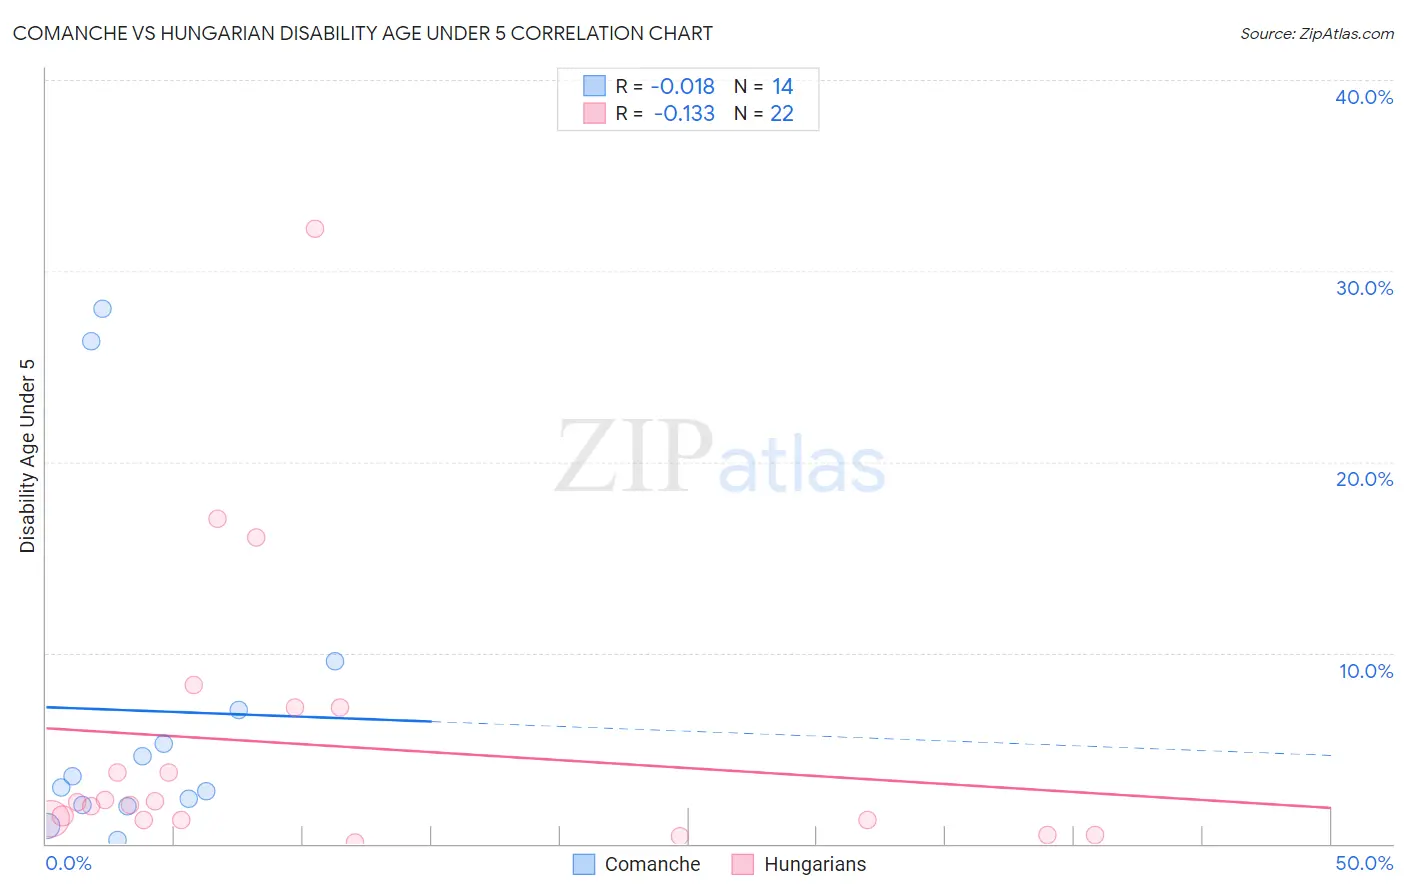
Comanche vs Hungarian Disability Age Under 5 Correlation Chart
The statistical analysis conducted on geographies consisting of 83,999,768 people shows no correlation between the proportion of Comanche and percentage of population with a disability under the age of 5 in the United States with a correlation coefficient (R) of -0.018 and weighted average of 1.2%. Similarly, the statistical analysis conducted on geographies consisting of 239,705,292 people shows a poor negative correlation between the proportion of Hungarians and percentage of population with a disability under the age of 5 in the United States with a correlation coefficient (R) of -0.133 and weighted average of 1.5%, a difference of 24.6%.
Disability Age Under 5 Correlation Summary
| Measurement | Comanche | Hungarian |
| Minimum | 0.20% | 0.082% |
| Maximum | 28.0% | 32.2% |
| Range | 27.8% | 32.1% |
| Mean | 7.0% | 5.2% |
| Median | 3.3% | 2.1% |
| Interquartile 25% (IQ1) | 2.0% | 1.2% |
| Interquartile 75% (IQ3) | 7.0% | 7.1% |
| Interquartile Range (IQR) | 5.0% | 5.9% |
| Standard Deviation (Sample) | 8.9% | 7.6% |
| Standard Deviation (Population) | 8.6% | 7.5% |
Similar Demographics by Disability Age Under 5
Demographics Similar to Comanche by Disability Age Under 5
In terms of disability age under 5, the demographic groups most similar to Comanche are Venezuelan (1.2%, a difference of 0.040%), Immigrants from Kenya (1.2%, a difference of 0.090%), Immigrants from Bahamas (1.2%, a difference of 0.21%), Immigrants from Latvia (1.2%, a difference of 0.22%), and Immigrants from Nigeria (1.2%, a difference of 0.22%).
| Demographics | Rating | Rank | Disability Age Under 5 |
| Immigrants | Jamaica | 58.8 /100 | #170 | Average 1.2% |
| Guamanians/Chamorros | 57.8 /100 | #171 | Average 1.2% |
| Crow | 51.0 /100 | #172 | Average 1.2% |
| Immigrants | Ireland | 50.3 /100 | #173 | Average 1.2% |
| Immigrants | Latvia | 50.0 /100 | #174 | Average 1.2% |
| Immigrants | Nigeria | 50.0 /100 | #175 | Average 1.2% |
| Immigrants | Kenya | 48.6 /100 | #176 | Average 1.2% |
| Comanche | 47.5 /100 | #177 | Average 1.2% |
| Venezuelans | 47.1 /100 | #178 | Average 1.2% |
| Immigrants | Bahamas | 45.2 /100 | #179 | Average 1.2% |
| Immigrants | Mexico | 44.4 /100 | #180 | Average 1.2% |
| Immigrants | Peru | 43.7 /100 | #181 | Average 1.2% |
| Macedonians | 43.7 /100 | #181 | Average 1.2% |
| Immigrants | Saudi Arabia | 43.3 /100 | #183 | Average 1.2% |
| Palestinians | 43.0 /100 | #184 | Average 1.2% |
Demographics Similar to Hungarians by Disability Age Under 5
In terms of disability age under 5, the demographic groups most similar to Hungarians are Czech (1.5%, a difference of 0.13%), Estonian (1.5%, a difference of 0.14%), Northern European (1.6%, a difference of 0.22%), Scandinavian (1.5%, a difference of 0.32%), and Tlingit-Haida (1.5%, a difference of 0.37%).
| Demographics | Rating | Rank | Disability Age Under 5 |
| Cheyenne | 0.0 /100 | #282 | Tragic 1.5% |
| Delaware | 0.0 /100 | #283 | Tragic 1.5% |
| Europeans | 0.0 /100 | #284 | Tragic 1.5% |
| Croatians | 0.0 /100 | #285 | Tragic 1.5% |
| Tlingit-Haida | 0.0 /100 | #286 | Tragic 1.5% |
| Scandinavians | 0.0 /100 | #287 | Tragic 1.5% |
| Estonians | 0.0 /100 | #288 | Tragic 1.5% |
| Hungarians | 0.0 /100 | #289 | Tragic 1.5% |
| Czechs | 0.0 /100 | #290 | Tragic 1.5% |
| Northern Europeans | 0.0 /100 | #291 | Tragic 1.6% |
| Italians | 0.0 /100 | #292 | Tragic 1.6% |
| Lithuanians | 0.0 /100 | #293 | Tragic 1.6% |
| Swedes | 0.0 /100 | #294 | Tragic 1.6% |
| Finns | 0.0 /100 | #295 | Tragic 1.6% |
| Poles | 0.0 /100 | #296 | Tragic 1.6% |