Immigrants from Albania vs Hungarian Disability Age Under 5
COMPARE
Immigrants from Albania
Hungarian
Disability Age Under 5
Disability Age Under 5 Comparison
Immigrants from Albania
Hungarians
1.1%
DISABILITY AGE UNDER 5
99.9/ 100
METRIC RATING
40th/ 347
METRIC RANK
1.5%
DISABILITY AGE UNDER 5
0.0/ 100
METRIC RATING
289th/ 347
METRIC RANK
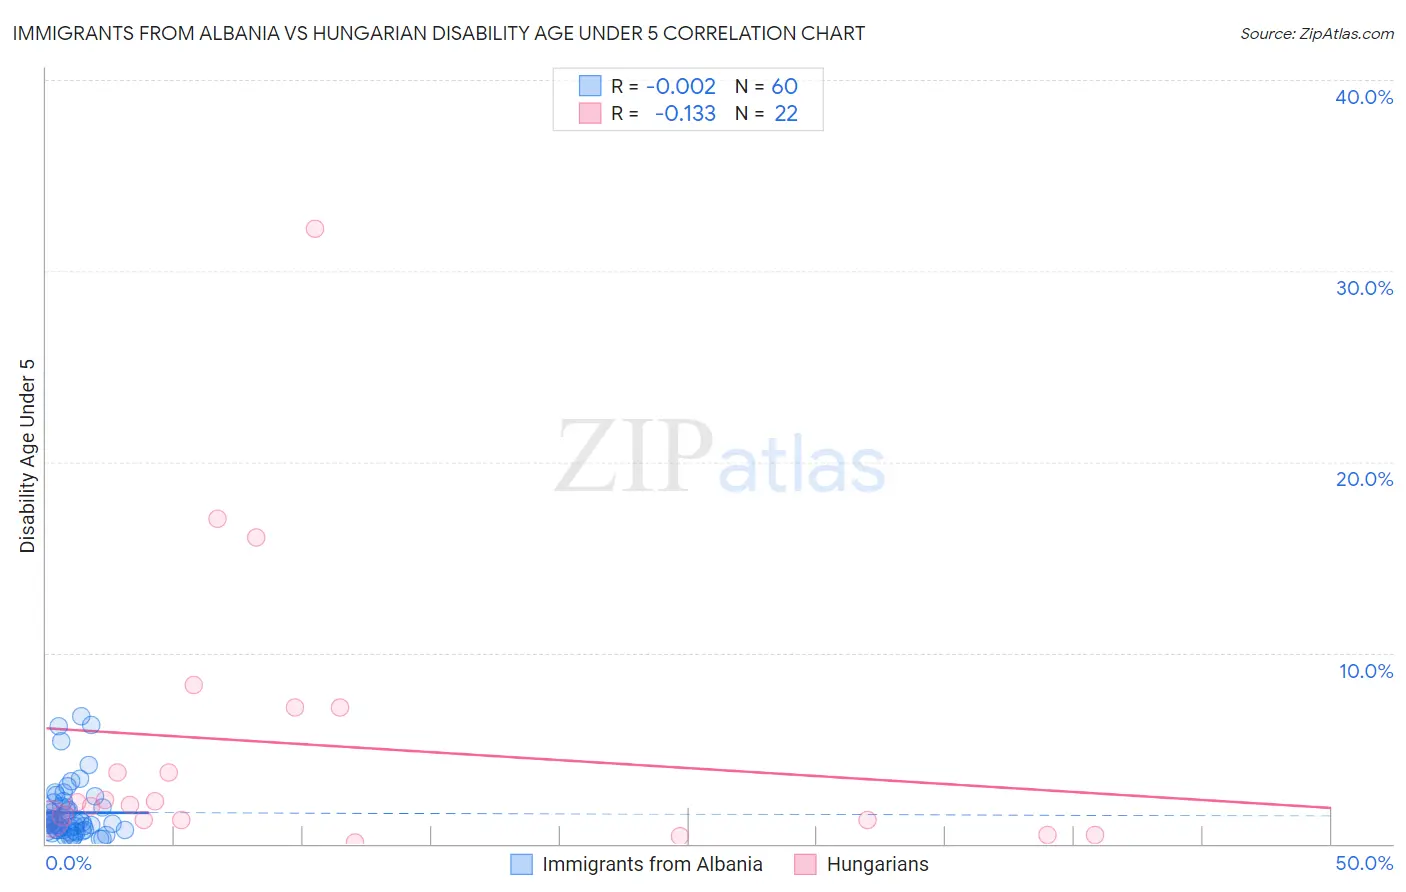
Immigrants from Albania vs Hungarian Disability Age Under 5 Correlation Chart
The statistical analysis conducted on geographies consisting of 82,683,996 people shows no correlation between the proportion of Immigrants from Albania and percentage of population with a disability under the age of 5 in the United States with a correlation coefficient (R) of -0.002 and weighted average of 1.1%. Similarly, the statistical analysis conducted on geographies consisting of 239,705,292 people shows a poor negative correlation between the proportion of Hungarians and percentage of population with a disability under the age of 5 in the United States with a correlation coefficient (R) of -0.133 and weighted average of 1.5%, a difference of 46.6%.
Disability Age Under 5 Correlation Summary
| Measurement | Immigrants from Albania | Hungarian |
| Minimum | 0.23% | 0.082% |
| Maximum | 6.6% | 32.2% |
| Range | 6.4% | 32.1% |
| Mean | 1.6% | 5.2% |
| Median | 1.1% | 2.1% |
| Interquartile 25% (IQ1) | 0.72% | 1.2% |
| Interquartile 75% (IQ3) | 1.9% | 7.1% |
| Interquartile Range (IQR) | 1.2% | 5.9% |
| Standard Deviation (Sample) | 1.5% | 7.6% |
| Standard Deviation (Population) | 1.5% | 7.5% |
Similar Demographics by Disability Age Under 5
Demographics Similar to Immigrants from Albania by Disability Age Under 5
In terms of disability age under 5, the demographic groups most similar to Immigrants from Albania are Filipino (1.1%, a difference of 0.33%), Thai (1.1%, a difference of 0.41%), Immigrants from Bulgaria (1.1%, a difference of 0.51%), Pima (1.1%, a difference of 0.52%), and Immigrants from Asia (1.1%, a difference of 0.61%).
| Demographics | Rating | Rank | Disability Age Under 5 |
| Bolivians | 99.9 /100 | #33 | Exceptional 1.0% |
| Immigrants | Ukraine | 99.9 /100 | #34 | Exceptional 1.0% |
| Barbadians | 99.9 /100 | #35 | Exceptional 1.0% |
| Immigrants | Nepal | 99.9 /100 | #36 | Exceptional 1.0% |
| Immigrants | India | 99.9 /100 | #37 | Exceptional 1.0% |
| Immigrants | Guyana | 99.9 /100 | #38 | Exceptional 1.0% |
| Filipinos | 99.9 /100 | #39 | Exceptional 1.1% |
| Immigrants | Albania | 99.9 /100 | #40 | Exceptional 1.1% |
| Thais | 99.8 /100 | #41 | Exceptional 1.1% |
| Immigrants | Bulgaria | 99.8 /100 | #42 | Exceptional 1.1% |
| Pima | 99.8 /100 | #43 | Exceptional 1.1% |
| Immigrants | Asia | 99.8 /100 | #44 | Exceptional 1.1% |
| Immigrants | Turkey | 99.8 /100 | #45 | Exceptional 1.1% |
| Immigrants | Congo | 99.8 /100 | #46 | Exceptional 1.1% |
| Immigrants | Sweden | 99.8 /100 | #47 | Exceptional 1.1% |
Demographics Similar to Hungarians by Disability Age Under 5
In terms of disability age under 5, the demographic groups most similar to Hungarians are Czech (1.5%, a difference of 0.13%), Estonian (1.5%, a difference of 0.14%), Northern European (1.6%, a difference of 0.22%), Scandinavian (1.5%, a difference of 0.32%), and Tlingit-Haida (1.5%, a difference of 0.37%).
| Demographics | Rating | Rank | Disability Age Under 5 |
| Cheyenne | 0.0 /100 | #282 | Tragic 1.5% |
| Delaware | 0.0 /100 | #283 | Tragic 1.5% |
| Europeans | 0.0 /100 | #284 | Tragic 1.5% |
| Croatians | 0.0 /100 | #285 | Tragic 1.5% |
| Tlingit-Haida | 0.0 /100 | #286 | Tragic 1.5% |
| Scandinavians | 0.0 /100 | #287 | Tragic 1.5% |
| Estonians | 0.0 /100 | #288 | Tragic 1.5% |
| Hungarians | 0.0 /100 | #289 | Tragic 1.5% |
| Czechs | 0.0 /100 | #290 | Tragic 1.5% |
| Northern Europeans | 0.0 /100 | #291 | Tragic 1.6% |
| Italians | 0.0 /100 | #292 | Tragic 1.6% |
| Lithuanians | 0.0 /100 | #293 | Tragic 1.6% |
| Swedes | 0.0 /100 | #294 | Tragic 1.6% |
| Finns | 0.0 /100 | #295 | Tragic 1.6% |
| Poles | 0.0 /100 | #296 | Tragic 1.6% |