Immigrants from Ghana vs Hungarian Disability Age Under 5
COMPARE
Immigrants from Ghana
Hungarian
Disability Age Under 5
Disability Age Under 5 Comparison
Immigrants from Ghana
Hungarians
1.2%
DISABILITY AGE UNDER 5
68.7/ 100
METRIC RATING
155th/ 347
METRIC RANK
1.5%
DISABILITY AGE UNDER 5
0.0/ 100
METRIC RATING
289th/ 347
METRIC RANK
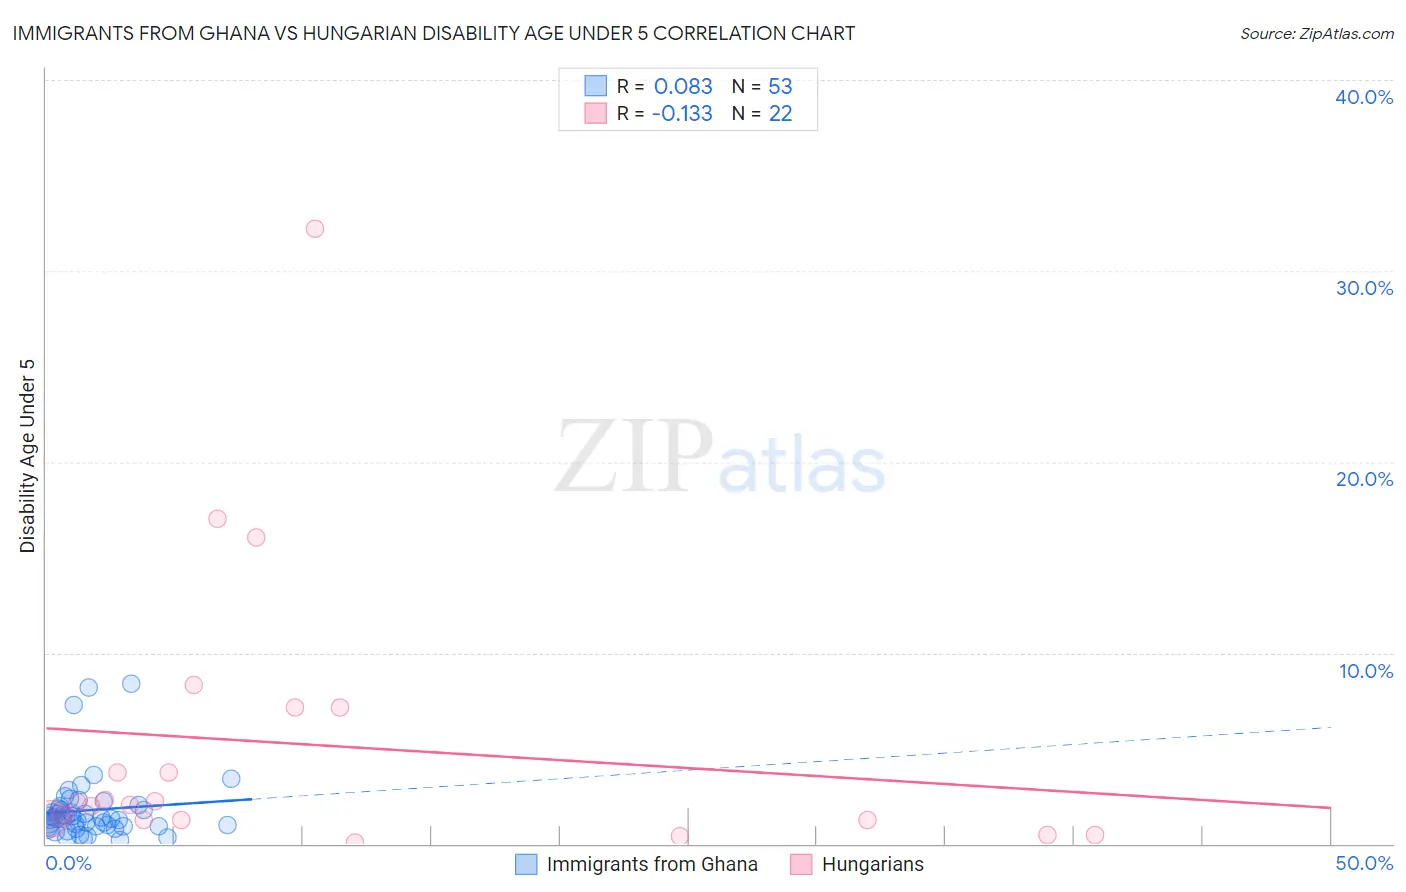
Immigrants from Ghana vs Hungarian Disability Age Under 5 Correlation Chart
The statistical analysis conducted on geographies consisting of 133,499,136 people shows a slight positive correlation between the proportion of Immigrants from Ghana and percentage of population with a disability under the age of 5 in the United States with a correlation coefficient (R) of 0.083 and weighted average of 1.2%. Similarly, the statistical analysis conducted on geographies consisting of 239,705,292 people shows a poor negative correlation between the proportion of Hungarians and percentage of population with a disability under the age of 5 in the United States with a correlation coefficient (R) of -0.133 and weighted average of 1.5%, a difference of 27.1%.
Disability Age Under 5 Correlation Summary
| Measurement | Immigrants from Ghana | Hungarian |
| Minimum | 0.20% | 0.082% |
| Maximum | 8.4% | 32.2% |
| Range | 8.2% | 32.1% |
| Mean | 1.8% | 5.2% |
| Median | 1.3% | 2.1% |
| Interquartile 25% (IQ1) | 0.92% | 1.2% |
| Interquartile 75% (IQ3) | 1.9% | 7.1% |
| Interquartile Range (IQR) | 0.96% | 5.9% |
| Standard Deviation (Sample) | 1.7% | 7.6% |
| Standard Deviation (Population) | 1.7% | 7.5% |
Similar Demographics by Disability Age Under 5
Demographics Similar to Immigrants from Ghana by Disability Age Under 5
In terms of disability age under 5, the demographic groups most similar to Immigrants from Ghana are Uruguayan (1.2%, a difference of 0.010%), Hawaiian (1.2%, a difference of 0.020%), Immigrants from Thailand (1.2%, a difference of 0.080%), Immigrants from South America (1.2%, a difference of 0.18%), and Arab (1.2%, a difference of 0.24%).
| Demographics | Rating | Rank | Disability Age Under 5 |
| Ghanaians | 76.3 /100 | #148 | Good 1.2% |
| Kenyans | 75.9 /100 | #149 | Good 1.2% |
| South Americans | 75.6 /100 | #150 | Good 1.2% |
| Yaqui | 74.8 /100 | #151 | Good 1.2% |
| Hondurans | 72.5 /100 | #152 | Good 1.2% |
| Immigrants | Thailand | 69.4 /100 | #153 | Good 1.2% |
| Uruguayans | 68.8 /100 | #154 | Good 1.2% |
| Immigrants | Ghana | 68.7 /100 | #155 | Good 1.2% |
| Hawaiians | 68.5 /100 | #156 | Good 1.2% |
| Immigrants | South America | 67.0 /100 | #157 | Good 1.2% |
| Arabs | 66.4 /100 | #158 | Good 1.2% |
| Colombians | 65.8 /100 | #159 | Good 1.2% |
| Immigrants | Latin America | 65.8 /100 | #160 | Good 1.2% |
| Immigrants | Africa | 65.1 /100 | #161 | Good 1.2% |
| Guatemalans | 63.6 /100 | #162 | Good 1.2% |
Demographics Similar to Hungarians by Disability Age Under 5
In terms of disability age under 5, the demographic groups most similar to Hungarians are Czech (1.5%, a difference of 0.13%), Estonian (1.5%, a difference of 0.14%), Northern European (1.6%, a difference of 0.22%), Scandinavian (1.5%, a difference of 0.32%), and Tlingit-Haida (1.5%, a difference of 0.37%).
| Demographics | Rating | Rank | Disability Age Under 5 |
| Cheyenne | 0.0 /100 | #282 | Tragic 1.5% |
| Delaware | 0.0 /100 | #283 | Tragic 1.5% |
| Europeans | 0.0 /100 | #284 | Tragic 1.5% |
| Croatians | 0.0 /100 | #285 | Tragic 1.5% |
| Tlingit-Haida | 0.0 /100 | #286 | Tragic 1.5% |
| Scandinavians | 0.0 /100 | #287 | Tragic 1.5% |
| Estonians | 0.0 /100 | #288 | Tragic 1.5% |
| Hungarians | 0.0 /100 | #289 | Tragic 1.5% |
| Czechs | 0.0 /100 | #290 | Tragic 1.5% |
| Northern Europeans | 0.0 /100 | #291 | Tragic 1.6% |
| Italians | 0.0 /100 | #292 | Tragic 1.6% |
| Lithuanians | 0.0 /100 | #293 | Tragic 1.6% |
| Swedes | 0.0 /100 | #294 | Tragic 1.6% |
| Finns | 0.0 /100 | #295 | Tragic 1.6% |
| Poles | 0.0 /100 | #296 | Tragic 1.6% |