Comanche vs Sioux Disability Age Under 5
COMPARE
Comanche
Sioux
Disability Age Under 5
Disability Age Under 5 Comparison
Comanche
Sioux
1.2%
DISABILITY AGE UNDER 5
47.5/ 100
METRIC RATING
177th/ 347
METRIC RANK
1.8%
DISABILITY AGE UNDER 5
0.0/ 100
METRIC RATING
326th/ 347
METRIC RANK
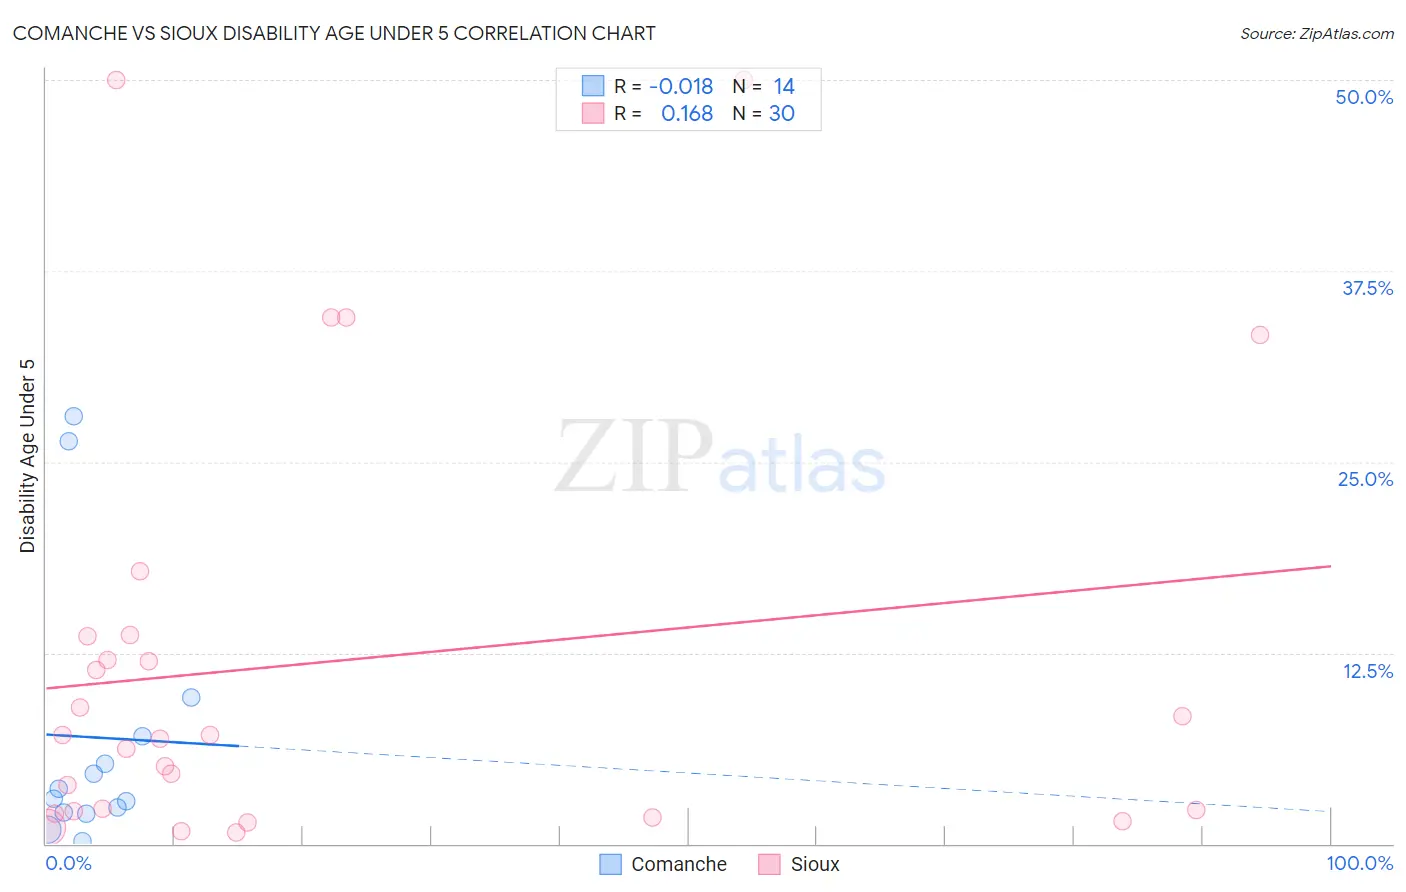
Comanche vs Sioux Disability Age Under 5 Correlation Chart
The statistical analysis conducted on geographies consisting of 83,999,768 people shows no correlation between the proportion of Comanche and percentage of population with a disability under the age of 5 in the United States with a correlation coefficient (R) of -0.018 and weighted average of 1.2%. Similarly, the statistical analysis conducted on geographies consisting of 151,129,395 people shows a poor positive correlation between the proportion of Sioux and percentage of population with a disability under the age of 5 in the United States with a correlation coefficient (R) of 0.168 and weighted average of 1.8%, a difference of 46.5%.
Disability Age Under 5 Correlation Summary
| Measurement | Comanche | Sioux |
| Minimum | 0.20% | 0.72% |
| Maximum | 28.0% | 50.0% |
| Range | 27.8% | 49.3% |
| Mean | 7.0% | 11.9% |
| Median | 3.3% | 7.0% |
| Interquartile 25% (IQ1) | 2.0% | 2.1% |
| Interquartile 75% (IQ3) | 7.0% | 13.6% |
| Interquartile Range (IQR) | 5.0% | 11.5% |
| Standard Deviation (Sample) | 8.9% | 14.1% |
| Standard Deviation (Population) | 8.6% | 13.9% |
Similar Demographics by Disability Age Under 5
Demographics Similar to Comanche by Disability Age Under 5
In terms of disability age under 5, the demographic groups most similar to Comanche are Venezuelan (1.2%, a difference of 0.040%), Immigrants from Kenya (1.2%, a difference of 0.090%), Immigrants from Bahamas (1.2%, a difference of 0.21%), Immigrants from Latvia (1.2%, a difference of 0.22%), and Immigrants from Nigeria (1.2%, a difference of 0.22%).
| Demographics | Rating | Rank | Disability Age Under 5 |
| Immigrants | Jamaica | 58.8 /100 | #170 | Average 1.2% |
| Guamanians/Chamorros | 57.8 /100 | #171 | Average 1.2% |
| Crow | 51.0 /100 | #172 | Average 1.2% |
| Immigrants | Ireland | 50.3 /100 | #173 | Average 1.2% |
| Immigrants | Latvia | 50.0 /100 | #174 | Average 1.2% |
| Immigrants | Nigeria | 50.0 /100 | #175 | Average 1.2% |
| Immigrants | Kenya | 48.6 /100 | #176 | Average 1.2% |
| Comanche | 47.5 /100 | #177 | Average 1.2% |
| Venezuelans | 47.1 /100 | #178 | Average 1.2% |
| Immigrants | Bahamas | 45.2 /100 | #179 | Average 1.2% |
| Immigrants | Mexico | 44.4 /100 | #180 | Average 1.2% |
| Immigrants | Peru | 43.7 /100 | #181 | Average 1.2% |
| Macedonians | 43.7 /100 | #181 | Average 1.2% |
| Immigrants | Saudi Arabia | 43.3 /100 | #183 | Average 1.2% |
| Palestinians | 43.0 /100 | #184 | Average 1.2% |
Demographics Similar to Sioux by Disability Age Under 5
In terms of disability age under 5, the demographic groups most similar to Sioux are Osage (1.8%, a difference of 0.39%), Immigrants from Portugal (1.8%, a difference of 1.4%), American (1.9%, a difference of 2.1%), Houma (1.9%, a difference of 2.6%), and Cherokee (1.8%, a difference of 2.8%).
| Demographics | Rating | Rank | Disability Age Under 5 |
| Slovaks | 0.0 /100 | #319 | Tragic 1.7% |
| Scotch-Irish | 0.0 /100 | #320 | Tragic 1.7% |
| Ottawa | 0.0 /100 | #321 | Tragic 1.7% |
| Germans | 0.0 /100 | #322 | Tragic 1.7% |
| Chickasaw | 0.0 /100 | #323 | Tragic 1.7% |
| Cherokee | 0.0 /100 | #324 | Tragic 1.8% |
| Immigrants | Portugal | 0.0 /100 | #325 | Tragic 1.8% |
| Sioux | 0.0 /100 | #326 | Tragic 1.8% |
| Osage | 0.0 /100 | #327 | Tragic 1.8% |
| Americans | 0.0 /100 | #328 | Tragic 1.9% |
| Houma | 0.0 /100 | #329 | Tragic 1.9% |
| Choctaw | 0.0 /100 | #330 | Tragic 1.9% |
| French Canadians | 0.0 /100 | #331 | Tragic 1.9% |
| Chippewa | 0.0 /100 | #332 | Tragic 1.9% |
| Dutch West Indians | 0.0 /100 | #333 | Tragic 1.9% |