Comanche vs Immigrants from Croatia Disability Age Under 5
COMPARE
Comanche
Immigrants from Croatia
Disability Age Under 5
Disability Age Under 5 Comparison
Comanche
Immigrants from Croatia
1.2%
DISABILITY AGE UNDER 5
47.5/ 100
METRIC RATING
177th/ 347
METRIC RANK
1.3%
DISABILITY AGE UNDER 5
11.2/ 100
METRIC RATING
219th/ 347
METRIC RANK
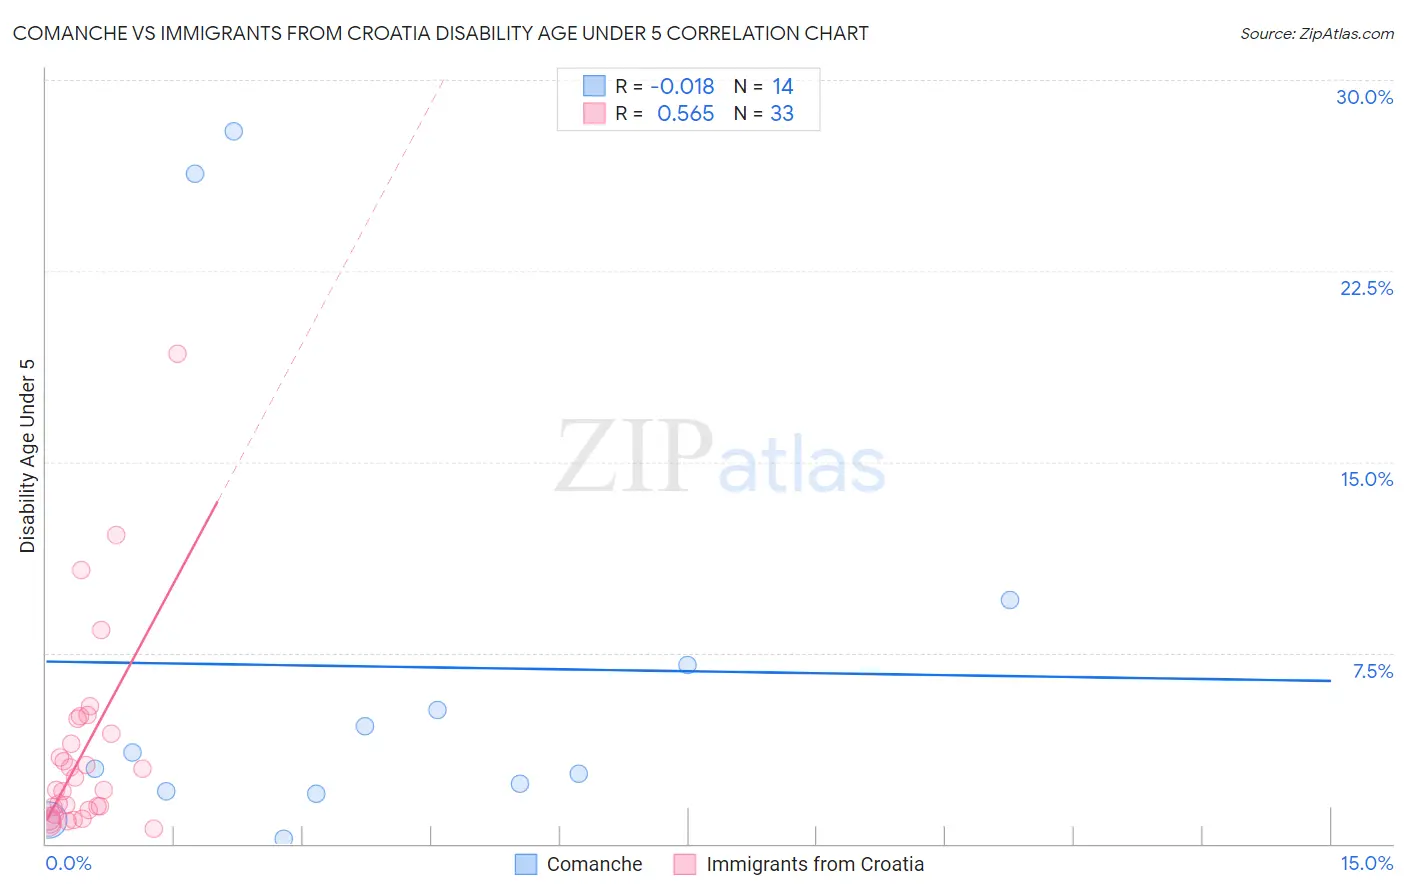
Comanche vs Immigrants from Croatia Disability Age Under 5 Correlation Chart
The statistical analysis conducted on geographies consisting of 83,999,768 people shows no correlation between the proportion of Comanche and percentage of population with a disability under the age of 5 in the United States with a correlation coefficient (R) of -0.018 and weighted average of 1.2%. Similarly, the statistical analysis conducted on geographies consisting of 91,296,638 people shows a substantial positive correlation between the proportion of Immigrants from Croatia and percentage of population with a disability under the age of 5 in the United States with a correlation coefficient (R) of 0.565 and weighted average of 1.3%, a difference of 4.4%.
Disability Age Under 5 Correlation Summary
| Measurement | Comanche | Immigrants from Croatia |
| Minimum | 0.20% | 0.59% |
| Maximum | 28.0% | 19.2% |
| Range | 27.8% | 18.6% |
| Mean | 7.0% | 3.6% |
| Median | 3.3% | 2.1% |
| Interquartile 25% (IQ1) | 2.0% | 1.2% |
| Interquartile 75% (IQ3) | 7.0% | 4.6% |
| Interquartile Range (IQR) | 5.0% | 3.4% |
| Standard Deviation (Sample) | 8.9% | 3.9% |
| Standard Deviation (Population) | 8.6% | 3.9% |
Similar Demographics by Disability Age Under 5
Demographics Similar to Comanche by Disability Age Under 5
In terms of disability age under 5, the demographic groups most similar to Comanche are Venezuelan (1.2%, a difference of 0.040%), Immigrants from Kenya (1.2%, a difference of 0.090%), Immigrants from Bahamas (1.2%, a difference of 0.21%), Immigrants from Latvia (1.2%, a difference of 0.22%), and Immigrants from Nigeria (1.2%, a difference of 0.22%).
| Demographics | Rating | Rank | Disability Age Under 5 |
| Immigrants | Jamaica | 58.8 /100 | #170 | Average 1.2% |
| Guamanians/Chamorros | 57.8 /100 | #171 | Average 1.2% |
| Crow | 51.0 /100 | #172 | Average 1.2% |
| Immigrants | Ireland | 50.3 /100 | #173 | Average 1.2% |
| Immigrants | Latvia | 50.0 /100 | #174 | Average 1.2% |
| Immigrants | Nigeria | 50.0 /100 | #175 | Average 1.2% |
| Immigrants | Kenya | 48.6 /100 | #176 | Average 1.2% |
| Comanche | 47.5 /100 | #177 | Average 1.2% |
| Venezuelans | 47.1 /100 | #178 | Average 1.2% |
| Immigrants | Bahamas | 45.2 /100 | #179 | Average 1.2% |
| Immigrants | Mexico | 44.4 /100 | #180 | Average 1.2% |
| Immigrants | Peru | 43.7 /100 | #181 | Average 1.2% |
| Macedonians | 43.7 /100 | #181 | Average 1.2% |
| Immigrants | Saudi Arabia | 43.3 /100 | #183 | Average 1.2% |
| Palestinians | 43.0 /100 | #184 | Average 1.2% |
Demographics Similar to Immigrants from Croatia by Disability Age Under 5
In terms of disability age under 5, the demographic groups most similar to Immigrants from Croatia are Serbian (1.3%, a difference of 0.37%), Malaysian (1.3%, a difference of 0.40%), Subsaharan African (1.3%, a difference of 0.71%), Ukrainian (1.3%, a difference of 0.71%), and Cypriot (1.3%, a difference of 0.72%).
| Demographics | Rating | Rank | Disability Age Under 5 |
| Chileans | 18.8 /100 | #212 | Poor 1.3% |
| Immigrants | Sudan | 18.7 /100 | #213 | Poor 1.3% |
| Immigrants | Chile | 17.2 /100 | #214 | Poor 1.3% |
| Syrians | 16.1 /100 | #215 | Poor 1.3% |
| Bangladeshis | 15.5 /100 | #216 | Poor 1.3% |
| Cypriots | 14.9 /100 | #217 | Poor 1.3% |
| Malaysians | 13.2 /100 | #218 | Poor 1.3% |
| Immigrants | Croatia | 11.2 /100 | #219 | Poor 1.3% |
| Serbians | 9.6 /100 | #220 | Tragic 1.3% |
| Sub-Saharan Africans | 8.3 /100 | #221 | Tragic 1.3% |
| Ukrainians | 8.3 /100 | #222 | Tragic 1.3% |
| Hispanics or Latinos | 7.7 /100 | #223 | Tragic 1.3% |
| Latvians | 7.1 /100 | #224 | Tragic 1.3% |
| Panamanians | 7.1 /100 | #225 | Tragic 1.3% |
| Bahamians | 7.1 /100 | #226 | Tragic 1.3% |