Comanche vs Hungarian Male Unemployment

COMPARE

Comanche
Race
Ancestry
AfghanAfricanAlaska NativeAlaskan AthabascanAlbanianAleutAlsatianAmericanApacheArabArapahoArgentineanArmenianAssyrian/Chaldean/SyriacAustralianAustrianBahamianBangladeshiBarbadianBasqueBelgianBelizeanBermudanBhutaneseBlackfeetBolivianBrazilianBritishBritish West IndianBulgarianBurmeseCajunCambodianCanadianCape VerdeanCarpatho RusynCelticCentral AmericanCentral American IndianCherokeeCheyenneChickasawChileanChineseChippewaChoctawColombianColvilleComancheCosta RicanCreeCreekCroatianCrowCubanCypriotCzechCzechoslovakianDanishDelawareDominicanDutchDutch West IndianEastern EuropeanEcuadorianEgyptianEnglishEstonianEthiopianEuropeanFijianFilipinoFinnishFrenchFrench American IndianFrench CanadianGermanGerman RussianGhanaianGreekGuamanian/ChamorroGuatemalanGuyaneseHaitianHmongHonduranHopiHoumaIcelanderIndian (Asian)IndonesianInupiatIranianIraqiIrishIroquoisIsraeliItalianJamaicanJapaneseJordanianKenyanKiowaKoreanLaotianLatvianLebaneseLiberianLithuanianLumbeeLuxembourgerMacedonianMalaysianMalteseMarshalleseMenomineeMexicanMexican American IndianMongolianMoroccanNative HawaiianNavajoNepaleseNew ZealanderNicaraguanNigerianNorthern EuropeanNorwegianOkinawanOsageOttawaPaiutePakistaniPalestinianPanamanianParaguayanPennsylvania GermanPeruvianPimaPolishPortuguesePotawatomiPuebloPuerto RicanPuget Sound SalishRomanianRussianSalvadoranSamoanScandinavianScotch-IrishScottishSeminoleSenegaleseSerbianShoshoneSierra LeoneanSiouxSlavicSlovakSloveneSomaliSouth AfricanSouth AmericanSouth American IndianSoviet UnionSpaniardSpanishSpanish AmericanSpanish American IndianSri LankanSubsaharan AfricanSudaneseSwedishSwissSyrianTaiwaneseThaiTlingit-HaidaTohono O'OdhamTonganTrinidadian and TobagonianTsimshianTurkishU.S. Virgin IslanderUgandanUkrainianUruguayanUteVenezuelanVietnameseWelshWest IndianYakamaYaquiYugoslavianYumanYup'ikZimbabwean
Immigration
NonimmigrantsImmigrantsAfghanistanAfricaAlbaniaArgentinaArmeniaAsiaAustraliaAustriaBahamasBangladeshBarbadosBelarusBelgiumBelizeBoliviaBosnia and HerzegovinaBrazilBulgariaBurma/MyanmarCabo VerdeCambodiaCameroonCanadaCaribbeanCentral AmericaChileChinaColombiaCongoCosta RicaCroatiaCubaCzechoslovakiaDenmarkDominicaDominican RepublicEastern AfricaEastern AsiaEastern EuropeEcuadorEgyptEl SalvadorEnglandEritreaEthiopiaEuropeFijiFranceGermanyGhanaGreeceGrenadaGuatemalaGuyanaHaitiHondurasHong KongHungaryIndiaIndonesiaIranIraqIrelandIsraelItalyJamaicaJapanJordanKazakhstanKenyaKoreaKuwaitLaosLatin AmericaLatviaLebanonLiberiaLithuaniaMalaysiaMexicoMicronesiaMiddle AfricaMoldovaMoroccoNepalNetherlandsNicaraguaNigeriaNorth AmericaNorth MacedoniaNorthern AfricaNorthern EuropeNorwayOceaniaPakistanPanamaPeruPhilippinesPolandPortugalRomaniaRussiaSaudi ArabiaScotlandSenegalSerbiaSierra LeoneSingaporeSomaliaSouth AfricaSouth AmericaSouth Central AsiaSouth Eastern AsiaSouthern EuropeSpainSri LankaSt. Vincent and the GrenadinesSudanSwedenSwitzerlandSyriaTaiwanThailandTrinidad and TobagoTurkeyUgandaUkraineUruguayUzbekistanVenezuelaVietnamWest IndiesWestern AfricaWestern AsiaWestern EuropeYemenZaireZimbabweAzores
Hungarian
Race
Ancestry
AfghanAfricanAlaska NativeAlaskan AthabascanAlbanianAleutAlsatianAmericanApacheArabArapahoArgentineanArmenianAssyrian/Chaldean/SyriacAustralianAustrianBahamianBangladeshiBarbadianBasqueBelgianBelizeanBermudanBhutaneseBlackfeetBolivianBrazilianBritishBritish West IndianBulgarianBurmeseCajunCambodianCanadianCape VerdeanCarpatho RusynCelticCentral AmericanCentral American IndianCherokeeCheyenneChickasawChileanChineseChippewaChoctawColombianColvilleCosta RicanCreeCreekCroatianCrowCubanCypriotCzechCzechoslovakianDanishDelawareDominicanDutchDutch West IndianEastern EuropeanEcuadorianEgyptianEnglishEstonianEthiopianEuropeanFijianFilipinoFinnishFrenchFrench American IndianFrench CanadianGermanGerman RussianGhanaianGreekGuamanian/ChamorroGuatemalanGuyaneseHaitianHmongHonduranHopiHoumaHungarianIcelanderIndian (Asian)IndonesianInupiatIranianIraqiIrishIroquoisIsraeliItalianJamaicanJapaneseJordanianKenyanKiowaKoreanLaotianLatvianLebaneseLiberianLithuanianLumbeeLuxembourgerMacedonianMalaysianMalteseMarshalleseMenomineeMexicanMexican American IndianMongolianMoroccanNative HawaiianNavajoNepaleseNew ZealanderNicaraguanNigerianNorthern EuropeanNorwegianOkinawanOsageOttawaPaiutePakistaniPalestinianPanamanianParaguayanPennsylvania GermanPeruvianPimaPolishPortuguesePotawatomiPuebloPuerto RicanPuget Sound SalishRomanianRussianSalvadoranSamoanScandinavianScotch-IrishScottishSeminoleSenegaleseSerbianShoshoneSierra LeoneanSiouxSlavicSlovakSloveneSomaliSouth AfricanSouth AmericanSouth American IndianSoviet UnionSpaniardSpanishSpanish AmericanSpanish American IndianSri LankanSubsaharan AfricanSudaneseSwedishSwissSyrianTaiwaneseThaiTlingit-HaidaTohono O'OdhamTonganTrinidadian and TobagonianTsimshianTurkishU.S. Virgin IslanderUgandanUkrainianUruguayanUteVenezuelanVietnameseWelshWest IndianYakamaYaquiYugoslavianYumanYup'ikZimbabwean
Immigration
NonimmigrantsImmigrantsAfghanistanAfricaAlbaniaArgentinaArmeniaAsiaAustraliaAustriaBahamasBangladeshBarbadosBelarusBelgiumBelizeBoliviaBosnia and HerzegovinaBrazilBulgariaBurma/MyanmarCabo VerdeCambodiaCameroonCanadaCaribbeanCentral AmericaChileChinaColombiaCongoCosta RicaCroatiaCubaCzechoslovakiaDenmarkDominicaDominican RepublicEastern AfricaEastern AsiaEastern EuropeEcuadorEgyptEl SalvadorEnglandEritreaEthiopiaEuropeFijiFranceGermanyGhanaGreeceGrenadaGuatemalaGuyanaHaitiHondurasHong KongHungaryIndiaIndonesiaIranIraqIrelandIsraelItalyJamaicaJapanJordanKazakhstanKenyaKoreaKuwaitLaosLatin AmericaLatviaLebanonLiberiaLithuaniaMalaysiaMexicoMicronesiaMiddle AfricaMoldovaMoroccoNepalNetherlandsNicaraguaNigeriaNorth AmericaNorth MacedoniaNorthern AfricaNorthern EuropeNorwayOceaniaPakistanPanamaPeruPhilippinesPolandPortugalRomaniaRussiaSaudi ArabiaScotlandSenegalSerbiaSierra LeoneSingaporeSomaliaSouth AfricaSouth AmericaSouth Central AsiaSouth Eastern AsiaSouthern EuropeSpainSri LankaSt. Vincent and the GrenadinesSudanSwedenSwitzerlandSyriaTaiwanThailandTrinidad and TobagoTurkeyUgandaUkraineUruguayUzbekistanVenezuelaVietnamWest IndiesWestern AfricaWestern AsiaWestern EuropeYemenZaireZimbabweAzores
Male Unemployment
Income
Poverty
Unemployment
Labor Participation
Family Structure
Vehicle Availability
Education Level
Disability

Male Unemployment Comparison

Comanche

Hungarians

Tragic
Excellent
5.8%
MALE UNEMPLOYMENT
0.2/ 100
METRIC RATING
256th/ 347
METRIC RANK
5.2%
MALE UNEMPLOYMENT
85.1/ 100
METRIC RATING
128th/ 347
METRIC RANK

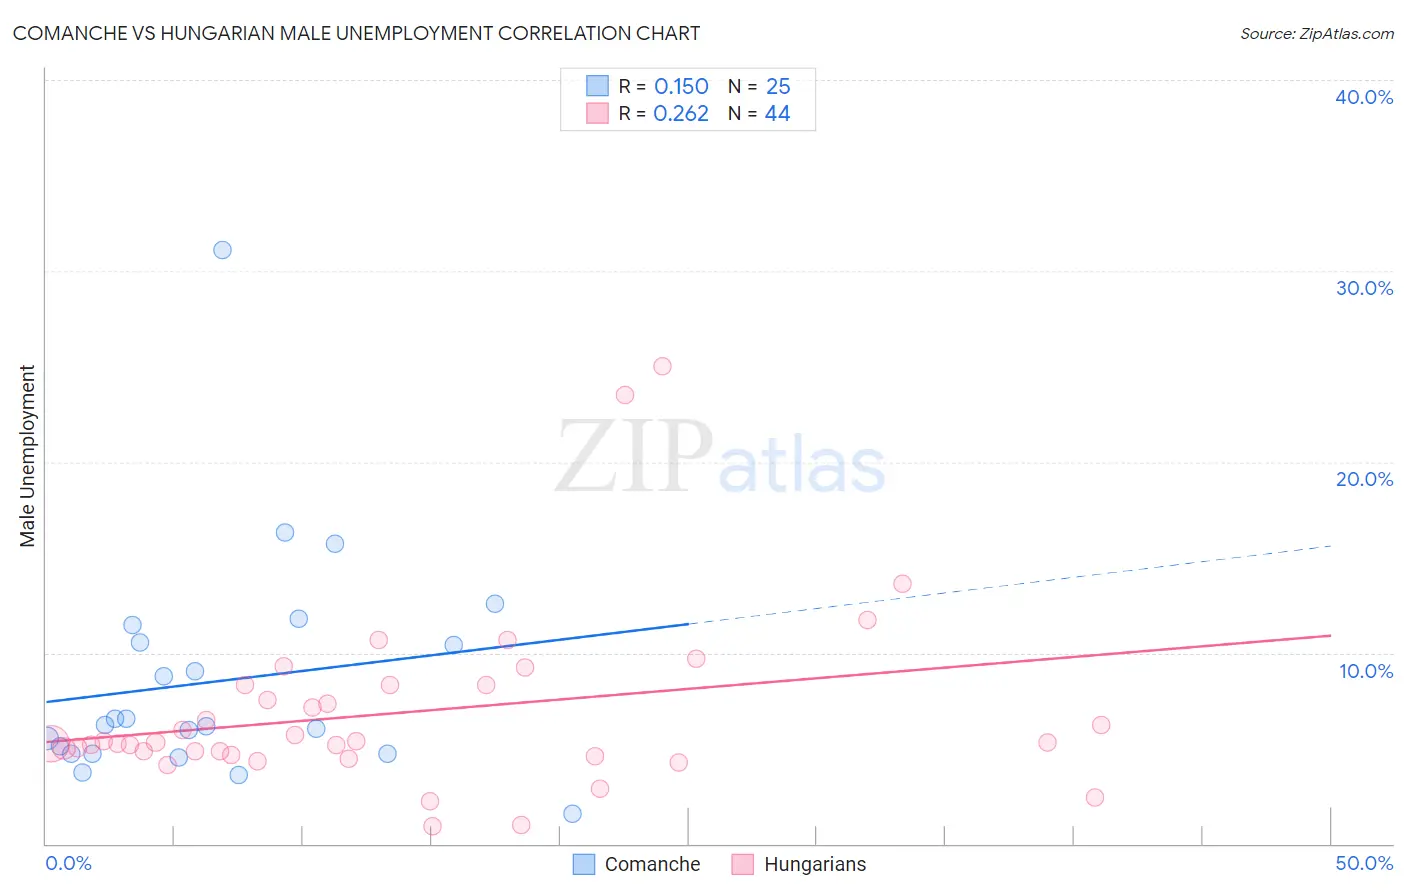
Comanche vs Hungarian Male Unemployment Correlation Chart

The statistical analysis conducted on geographies consisting of 109,543,085 people shows a poor positive correlation between the proportion of Comanche and unemployment rate among males in the United States with a correlation coefficient (R) of 0.150 and weighted average of 5.8%. Similarly, the statistical analysis conducted on geographies consisting of 482,025,300 people shows a weak positive correlation between the proportion of Hungarians and unemployment rate among males in the United States with a correlation coefficient (R) of 0.262 and weighted average of 5.2%, a difference of 12.3%.
Comanche vs Hungarian Male Unemployment

Male Unemployment Correlation Summary

MeasurementComancheHungarian
Minimum1.6%0.92%
Maximum31.1%25.0%
Range29.5%24.1%
Mean8.5%6.9%
Median6.2%5.3%
Interquartile 25% (IQ1)4.7%4.7%
Interquartile 75% (IQ3)11.0%8.3%
Interquartile Range (IQR)6.3%3.6%
Standard Deviation (Sample)6.0%4.7%
Standard Deviation (Population)5.9%4.6%

Similar Demographics by Male Unemployment

Demographics Similar to Comanche by Male Unemployment

In terms of male unemployment, the demographic groups most similar to Comanche are Kiowa (5.8%, a difference of 0.080%), Hispanic or Latino (5.8%, a difference of 0.17%), Japanese (5.8%, a difference of 0.18%), Dutch West Indian (5.8%, a difference of 0.30%), and Mexican American Indian (5.8%, a difference of 0.35%).
DemographicsRating | RankMale Unemployment
Cree
0.4
/100
|
#249
Tragic
5.7%
Immigrants | Bahamas
0.4
/100
|
#250
Tragic
5.7%
Spanish Americans
0.3
/100
|
#251
Tragic
5.7%
Mexicans
0.2
/100
|
#252
Tragic
5.8%
Mexican American Indians
0.2
/100
|
#253
Tragic
5.8%
Japanese
0.2
/100
|
#254
Tragic
5.8%
Kiowa
0.2
/100
|
#255
Tragic
5.8%
Comanche
0.2
/100
|
#256
Tragic
5.8%
Hispanics or Latinos
0.1
/100
|
#257
Tragic
5.8%
Dutch West Indians
0.1
/100
|
#258
Tragic
5.8%
Cajuns
0.1
/100
|
#259
Tragic
5.8%
Immigrants | Central America
0.1
/100
|
#260
Tragic
5.8%
Liberians
0.1
/100
|
#261
Tragic
5.8%
Immigrants | Portugal
0.1
/100
|
#262
Tragic
5.9%
Immigrants | Latin America
0.1
/100
|
#263
Tragic
5.9%

Demographics Similar to Hungarians by Male Unemployment

In terms of male unemployment, the demographic groups most similar to Hungarians are Immigrants from Western Europe (5.2%, a difference of 0.030%), Immigrants from Brazil (5.2%, a difference of 0.15%), Immigrants from Malaysia (5.2%, a difference of 0.18%), Immigrants from Colombia (5.1%, a difference of 0.21%), and Immigrants from Germany (5.2%, a difference of 0.23%).
DemographicsRating | RankMale Unemployment
Mongolians
88.4
/100
|
#121
Excellent
5.1%
Nicaraguans
88.2
/100
|
#122
Excellent
5.1%
Palestinians
87.7
/100
|
#123
Excellent
5.1%
Immigrants | Latvia
87.5
/100
|
#124
Excellent
5.1%
Immigrants | Lithuania
87.2
/100
|
#125
Excellent
5.1%
Immigrants | Colombia
86.8
/100
|
#126
Excellent
5.1%
Immigrants | Brazil
86.3
/100
|
#127
Excellent
5.2%
Hungarians
85.1
/100
|
#128
Excellent
5.2%
Immigrants | Western Europe
84.8
/100
|
#129
Excellent
5.2%
Immigrants | Malaysia
83.5
/100
|
#130
Excellent
5.2%
Immigrants | Germany
83.0
/100
|
#131
Excellent
5.2%
Chickasaw
82.9
/100
|
#132
Excellent
5.2%
Colombians
81.1
/100
|
#133
Excellent
5.2%
Pakistanis
80.5
/100
|
#134
Excellent
5.2%
Immigrants | Saudi Arabia
80.1
/100
|
#135
Excellent
5.2%