Colombian vs Immigrants from Croatia Ambulatory Disability
COMPARE
Colombian
Immigrants from Croatia
Ambulatory Disability
Ambulatory Disability Comparison
Colombians
Immigrants from Croatia
5.8%
AMBULATORY DISABILITY
97.2/ 100
METRIC RATING
108th/ 347
METRIC RANK
6.0%
AMBULATORY DISABILITY
75.1/ 100
METRIC RATING
154th/ 347
METRIC RANK
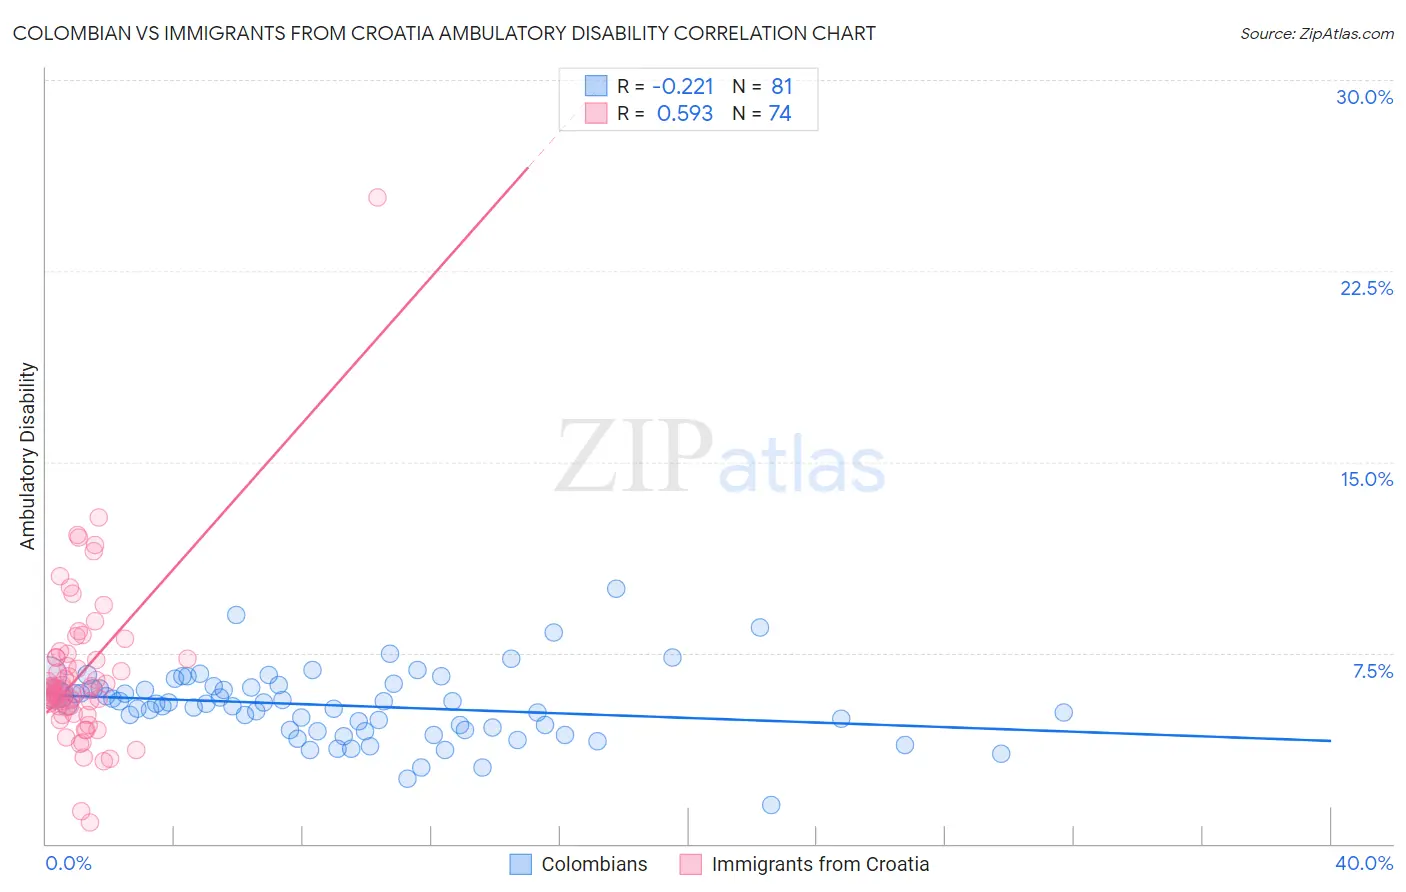
Colombian vs Immigrants from Croatia Ambulatory Disability Correlation Chart
The statistical analysis conducted on geographies consisting of 419,485,288 people shows a weak negative correlation between the proportion of Colombians and percentage of population with ambulatory disability in the United States with a correlation coefficient (R) of -0.221 and weighted average of 5.8%. Similarly, the statistical analysis conducted on geographies consisting of 132,566,129 people shows a substantial positive correlation between the proportion of Immigrants from Croatia and percentage of population with ambulatory disability in the United States with a correlation coefficient (R) of 0.593 and weighted average of 6.0%, a difference of 3.4%.
Ambulatory Disability Correlation Summary
| Measurement | Colombian | Immigrants from Croatia |
| Minimum | 1.5% | 0.85% |
| Maximum | 10.0% | 25.4% |
| Range | 8.5% | 24.5% |
| Mean | 5.4% | 6.7% |
| Median | 5.5% | 6.1% |
| Interquartile 25% (IQ1) | 4.5% | 5.4% |
| Interquartile 75% (IQ3) | 6.2% | 7.3% |
| Interquartile Range (IQR) | 1.7% | 1.9% |
| Standard Deviation (Sample) | 1.4% | 3.2% |
| Standard Deviation (Population) | 1.4% | 3.1% |
Similar Demographics by Ambulatory Disability
Demographics Similar to Colombians by Ambulatory Disability
In terms of ambulatory disability, the demographic groups most similar to Colombians are Uruguayan (5.8%, a difference of 0.010%), Immigrants from Netherlands (5.8%, a difference of 0.020%), Immigrants from Morocco (5.8%, a difference of 0.070%), Immigrants from Czechoslovakia (5.8%, a difference of 0.14%), and Immigrants from Colombia (5.8%, a difference of 0.19%).
| Demographics | Rating | Rank | Ambulatory Disability |
| Immigrants | South America | 97.9 /100 | #101 | Exceptional 5.8% |
| Immigrants | Kenya | 97.8 /100 | #102 | Exceptional 5.8% |
| Immigrants | Romania | 97.7 /100 | #103 | Exceptional 5.8% |
| New Zealanders | 97.6 /100 | #104 | Exceptional 5.8% |
| Immigrants | Czechoslovakia | 97.4 /100 | #105 | Exceptional 5.8% |
| Immigrants | Morocco | 97.3 /100 | #106 | Exceptional 5.8% |
| Uruguayans | 97.2 /100 | #107 | Exceptional 5.8% |
| Colombians | 97.2 /100 | #108 | Exceptional 5.8% |
| Immigrants | Netherlands | 97.1 /100 | #109 | Exceptional 5.8% |
| Immigrants | Colombia | 96.7 /100 | #110 | Exceptional 5.8% |
| Danes | 96.6 /100 | #111 | Exceptional 5.8% |
| South Africans | 96.3 /100 | #112 | Exceptional 5.9% |
| Immigrants | Uruguay | 95.6 /100 | #113 | Exceptional 5.9% |
| Immigrants | Poland | 95.4 /100 | #114 | Exceptional 5.9% |
| South American Indians | 94.8 /100 | #115 | Exceptional 5.9% |
Demographics Similar to Immigrants from Croatia by Ambulatory Disability
In terms of ambulatory disability, the demographic groups most similar to Immigrants from Croatia are Syrian (6.0%, a difference of 0.030%), Immigrants from Scotland (6.0%, a difference of 0.21%), Northern European (6.0%, a difference of 0.23%), Ghanaian (6.0%, a difference of 0.26%), and Immigrants from Fiji (6.0%, a difference of 0.27%).
| Demographics | Rating | Rank | Ambulatory Disability |
| Immigrants | Moldova | 82.4 /100 | #147 | Excellent 6.0% |
| Immigrants | Eastern Europe | 82.0 /100 | #148 | Excellent 6.0% |
| Lithuanians | 81.9 /100 | #149 | Excellent 6.0% |
| Maltese | 81.6 /100 | #150 | Excellent 6.0% |
| Greeks | 79.6 /100 | #151 | Good 6.0% |
| Immigrants | Austria | 78.8 /100 | #152 | Good 6.0% |
| Syrians | 75.5 /100 | #153 | Good 6.0% |
| Immigrants | Croatia | 75.1 /100 | #154 | Good 6.0% |
| Immigrants | Scotland | 72.1 /100 | #155 | Good 6.0% |
| Northern Europeans | 71.8 /100 | #156 | Good 6.0% |
| Ghanaians | 71.3 /100 | #157 | Good 6.0% |
| Immigrants | Fiji | 71.2 /100 | #158 | Good 6.0% |
| Immigrants | Latvia | 71.1 /100 | #159 | Good 6.0% |
| Central Americans | 69.8 /100 | #160 | Good 6.0% |
| Immigrants | Belarus | 69.2 /100 | #161 | Good 6.1% |