Colombian vs Immigrants from Trinidad and Tobago Ambulatory Disability
COMPARE
Colombian
Immigrants from Trinidad and Tobago
Ambulatory Disability
Ambulatory Disability Comparison
Colombians
Immigrants from Trinidad and Tobago
5.8%
AMBULATORY DISABILITY
97.2/ 100
METRIC RATING
108th/ 347
METRIC RANK
6.7%
AMBULATORY DISABILITY
0.1/ 100
METRIC RATING
271st/ 347
METRIC RANK
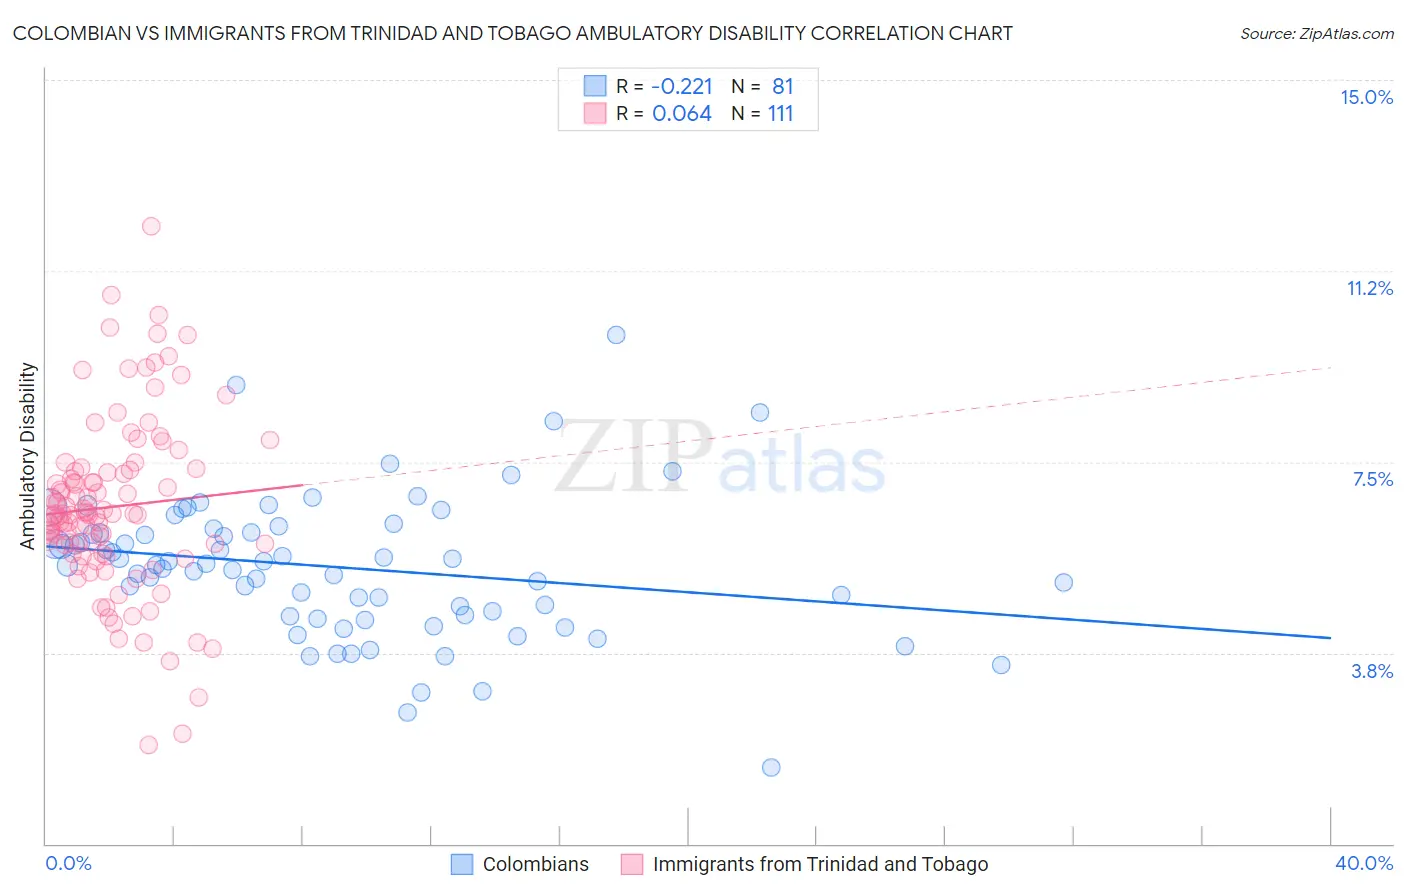
Colombian vs Immigrants from Trinidad and Tobago Ambulatory Disability Correlation Chart
The statistical analysis conducted on geographies consisting of 419,485,288 people shows a weak negative correlation between the proportion of Colombians and percentage of population with ambulatory disability in the United States with a correlation coefficient (R) of -0.221 and weighted average of 5.8%. Similarly, the statistical analysis conducted on geographies consisting of 223,483,943 people shows a slight positive correlation between the proportion of Immigrants from Trinidad and Tobago and percentage of population with ambulatory disability in the United States with a correlation coefficient (R) of 0.064 and weighted average of 6.7%, a difference of 14.3%.
Ambulatory Disability Correlation Summary
| Measurement | Colombian | Immigrants from Trinidad and Tobago |
| Minimum | 1.5% | 1.9% |
| Maximum | 10.0% | 12.1% |
| Range | 8.5% | 10.2% |
| Mean | 5.4% | 6.6% |
| Median | 5.5% | 6.5% |
| Interquartile 25% (IQ1) | 4.5% | 5.7% |
| Interquartile 75% (IQ3) | 6.2% | 7.3% |
| Interquartile Range (IQR) | 1.7% | 1.6% |
| Standard Deviation (Sample) | 1.4% | 1.7% |
| Standard Deviation (Population) | 1.4% | 1.7% |
Similar Demographics by Ambulatory Disability
Demographics Similar to Colombians by Ambulatory Disability
In terms of ambulatory disability, the demographic groups most similar to Colombians are Uruguayan (5.8%, a difference of 0.010%), Immigrants from Netherlands (5.8%, a difference of 0.020%), Immigrants from Morocco (5.8%, a difference of 0.070%), Immigrants from Czechoslovakia (5.8%, a difference of 0.14%), and Immigrants from Colombia (5.8%, a difference of 0.19%).
| Demographics | Rating | Rank | Ambulatory Disability |
| Immigrants | South America | 97.9 /100 | #101 | Exceptional 5.8% |
| Immigrants | Kenya | 97.8 /100 | #102 | Exceptional 5.8% |
| Immigrants | Romania | 97.7 /100 | #103 | Exceptional 5.8% |
| New Zealanders | 97.6 /100 | #104 | Exceptional 5.8% |
| Immigrants | Czechoslovakia | 97.4 /100 | #105 | Exceptional 5.8% |
| Immigrants | Morocco | 97.3 /100 | #106 | Exceptional 5.8% |
| Uruguayans | 97.2 /100 | #107 | Exceptional 5.8% |
| Colombians | 97.2 /100 | #108 | Exceptional 5.8% |
| Immigrants | Netherlands | 97.1 /100 | #109 | Exceptional 5.8% |
| Immigrants | Colombia | 96.7 /100 | #110 | Exceptional 5.8% |
| Danes | 96.6 /100 | #111 | Exceptional 5.8% |
| South Africans | 96.3 /100 | #112 | Exceptional 5.9% |
| Immigrants | Uruguay | 95.6 /100 | #113 | Exceptional 5.9% |
| Immigrants | Poland | 95.4 /100 | #114 | Exceptional 5.9% |
| South American Indians | 94.8 /100 | #115 | Exceptional 5.9% |
Demographics Similar to Immigrants from Trinidad and Tobago by Ambulatory Disability
In terms of ambulatory disability, the demographic groups most similar to Immigrants from Trinidad and Tobago are Slovak (6.7%, a difference of 0.10%), French (6.6%, a difference of 0.26%), French Canadian (6.7%, a difference of 0.36%), White/Caucasian (6.7%, a difference of 0.38%), and Spanish (6.6%, a difference of 0.56%).
| Demographics | Rating | Rank | Ambulatory Disability |
| Nepalese | 0.2 /100 | #264 | Tragic 6.6% |
| Bahamians | 0.2 /100 | #265 | Tragic 6.6% |
| Guyanese | 0.2 /100 | #266 | Tragic 6.6% |
| Trinidadians and Tobagonians | 0.2 /100 | #267 | Tragic 6.6% |
| Spanish | 0.2 /100 | #268 | Tragic 6.6% |
| French | 0.1 /100 | #269 | Tragic 6.6% |
| Slovaks | 0.1 /100 | #270 | Tragic 6.7% |
| Immigrants | Trinidad and Tobago | 0.1 /100 | #271 | Tragic 6.7% |
| French Canadians | 0.1 /100 | #272 | Tragic 6.7% |
| Whites/Caucasians | 0.1 /100 | #273 | Tragic 6.7% |
| Sioux | 0.1 /100 | #274 | Tragic 6.7% |
| Immigrants | Guyana | 0.1 /100 | #275 | Tragic 6.7% |
| Celtics | 0.1 /100 | #276 | Tragic 6.7% |
| Jamaicans | 0.1 /100 | #277 | Tragic 6.7% |
| Immigrants | West Indies | 0.1 /100 | #278 | Tragic 6.7% |