Colombian vs Chippewa Male Disability
COMPARE
Colombian
Chippewa
Male Disability
Male Disability Comparison
Colombians
Chippewa
10.5%
MALE DISABILITY
99.2/ 100
METRIC RATING
68th/ 347
METRIC RANK
14.3%
MALE DISABILITY
0.0/ 100
METRIC RATING
328th/ 347
METRIC RANK
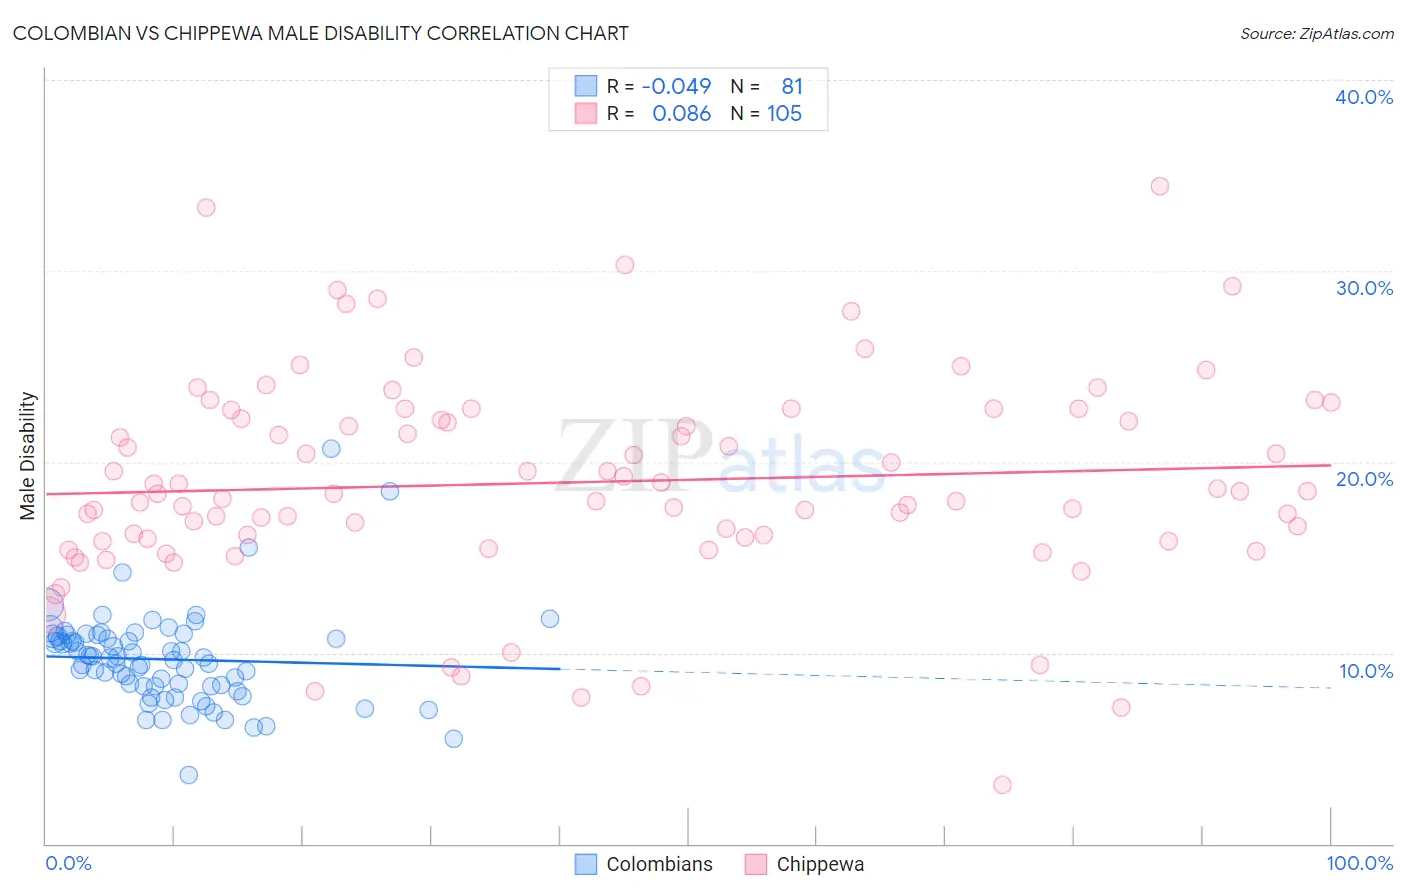
Colombian vs Chippewa Male Disability Correlation Chart
The statistical analysis conducted on geographies consisting of 419,578,648 people shows no correlation between the proportion of Colombians and percentage of males with a disability in the United States with a correlation coefficient (R) of -0.049 and weighted average of 10.5%. Similarly, the statistical analysis conducted on geographies consisting of 215,038,110 people shows a slight positive correlation between the proportion of Chippewa and percentage of males with a disability in the United States with a correlation coefficient (R) of 0.086 and weighted average of 14.3%, a difference of 36.4%.
Male Disability Correlation Summary
| Measurement | Colombian | Chippewa |
| Minimum | 3.6% | 3.1% |
| Maximum | 20.7% | 34.5% |
| Range | 17.1% | 31.4% |
| Mean | 9.7% | 18.9% |
| Median | 9.7% | 18.3% |
| Interquartile 25% (IQ1) | 8.2% | 15.9% |
| Interquartile 75% (IQ3) | 10.9% | 22.5% |
| Interquartile Range (IQR) | 2.7% | 6.6% |
| Standard Deviation (Sample) | 2.5% | 5.5% |
| Standard Deviation (Population) | 2.5% | 5.4% |
Similar Demographics by Male Disability
Demographics Similar to Colombians by Male Disability
In terms of male disability, the demographic groups most similar to Colombians are Ecuadorian (10.5%, a difference of 0.0%), Guyanese (10.5%, a difference of 0.10%), Immigrants from Afghanistan (10.5%, a difference of 0.10%), Immigrants from Grenada (10.5%, a difference of 0.11%), and Jordanian (10.5%, a difference of 0.13%).
| Demographics | Rating | Rank | Male Disability |
| Immigrants | Northern Africa | 99.4 /100 | #61 | Exceptional 10.4% |
| Immigrants | Ecuador | 99.3 /100 | #62 | Exceptional 10.4% |
| Immigrants | Belarus | 99.3 /100 | #63 | Exceptional 10.4% |
| Jordanians | 99.3 /100 | #64 | Exceptional 10.5% |
| Immigrants | Grenada | 99.2 /100 | #65 | Exceptional 10.5% |
| Guyanese | 99.2 /100 | #66 | Exceptional 10.5% |
| Immigrants | Afghanistan | 99.2 /100 | #67 | Exceptional 10.5% |
| Colombians | 99.2 /100 | #68 | Exceptional 10.5% |
| Ecuadorians | 99.2 /100 | #69 | Exceptional 10.5% |
| Immigrants | Bulgaria | 99.1 /100 | #70 | Exceptional 10.5% |
| Immigrants | Cameroon | 99.0 /100 | #71 | Exceptional 10.5% |
| Immigrants | Serbia | 99.0 /100 | #72 | Exceptional 10.5% |
| Immigrants | Lithuania | 98.9 /100 | #73 | Exceptional 10.5% |
| Immigrants | Lebanon | 98.8 /100 | #74 | Exceptional 10.5% |
| Sierra Leoneans | 98.7 /100 | #75 | Exceptional 10.5% |
Demographics Similar to Chippewa by Male Disability
In terms of male disability, the demographic groups most similar to Chippewa are Potawatomi (14.2%, a difference of 0.43%), Native/Alaskan (14.2%, a difference of 0.53%), Cajun (14.4%, a difference of 0.57%), Navajo (14.4%, a difference of 0.81%), and Ottawa (14.1%, a difference of 1.5%).
| Demographics | Rating | Rank | Male Disability |
| Shoshone | 0.0 /100 | #321 | Tragic 13.8% |
| Apache | 0.0 /100 | #322 | Tragic 14.0% |
| Osage | 0.0 /100 | #323 | Tragic 14.0% |
| Comanche | 0.0 /100 | #324 | Tragic 14.1% |
| Ottawa | 0.0 /100 | #325 | Tragic 14.1% |
| Natives/Alaskans | 0.0 /100 | #326 | Tragic 14.2% |
| Potawatomi | 0.0 /100 | #327 | Tragic 14.2% |
| Chippewa | 0.0 /100 | #328 | Tragic 14.3% |
| Cajuns | 0.0 /100 | #329 | Tragic 14.4% |
| Navajo | 0.0 /100 | #330 | Tragic 14.4% |
| Tohono O'odham | 0.0 /100 | #331 | Tragic 14.6% |
| Seminole | 0.0 /100 | #332 | Tragic 14.7% |
| Yuman | 0.0 /100 | #333 | Tragic 14.7% |
| Cherokee | 0.0 /100 | #334 | Tragic 14.8% |
| Dutch West Indians | 0.0 /100 | #335 | Tragic 14.8% |