Chippewa vs Japanese Ambulatory Disability
COMPARE
Chippewa
Japanese
Ambulatory Disability
Ambulatory Disability Comparison
Chippewa
Japanese
7.1%
AMBULATORY DISABILITY
0.0/ 100
METRIC RATING
308th/ 347
METRIC RANK
6.3%
AMBULATORY DISABILITY
12.0/ 100
METRIC RATING
213th/ 347
METRIC RANK
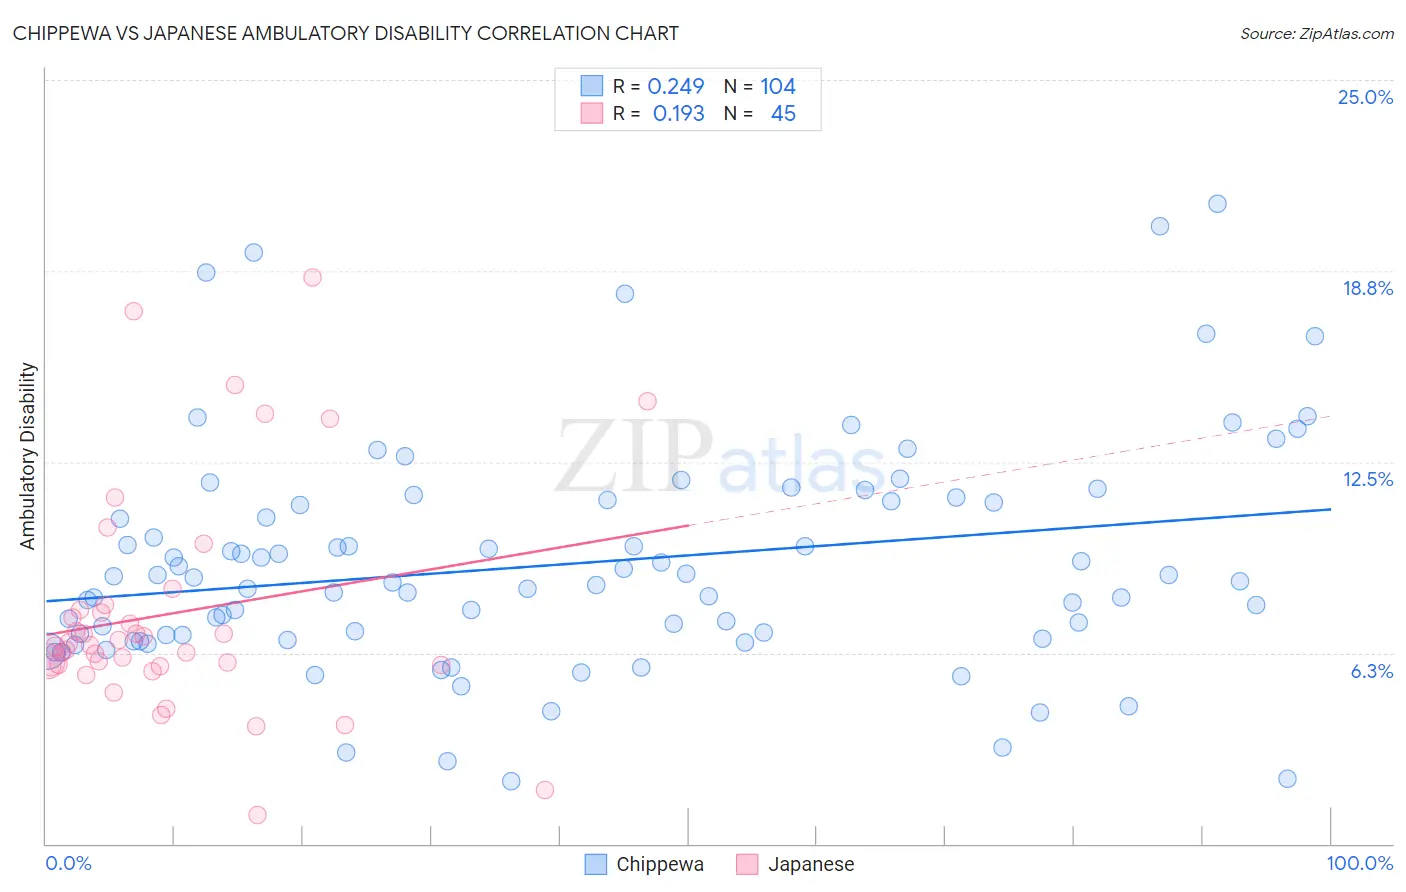
Chippewa vs Japanese Ambulatory Disability Correlation Chart
The statistical analysis conducted on geographies consisting of 215,009,829 people shows a weak positive correlation between the proportion of Chippewa and percentage of population with ambulatory disability in the United States with a correlation coefficient (R) of 0.249 and weighted average of 7.1%. Similarly, the statistical analysis conducted on geographies consisting of 249,121,214 people shows a poor positive correlation between the proportion of Japanese and percentage of population with ambulatory disability in the United States with a correlation coefficient (R) of 0.193 and weighted average of 6.3%, a difference of 12.6%.
Ambulatory Disability Correlation Summary
| Measurement | Chippewa | Japanese |
| Minimum | 2.0% | 0.93% |
| Maximum | 20.9% | 18.5% |
| Range | 18.9% | 17.6% |
| Mean | 9.1% | 7.5% |
| Median | 8.6% | 6.5% |
| Interquartile 25% (IQ1) | 6.8% | 5.8% |
| Interquartile 75% (IQ3) | 11.2% | 7.7% |
| Interquartile Range (IQR) | 4.4% | 1.9% |
| Standard Deviation (Sample) | 3.7% | 3.7% |
| Standard Deviation (Population) | 3.7% | 3.7% |
Similar Demographics by Ambulatory Disability
Demographics Similar to Chippewa by Ambulatory Disability
In terms of ambulatory disability, the demographic groups most similar to Chippewa are Spanish American (7.1%, a difference of 0.0%), Immigrants from the Azores (7.1%, a difference of 0.17%), Iroquois (7.1%, a difference of 0.27%), Arapaho (7.1%, a difference of 0.45%), and Cree (7.1%, a difference of 0.46%).
| Demographics | Rating | Rank | Ambulatory Disability |
| British West Indians | 0.0 /100 | #301 | Tragic 7.0% |
| Immigrants | Armenia | 0.0 /100 | #302 | Tragic 7.0% |
| Africans | 0.0 /100 | #303 | Tragic 7.0% |
| Immigrants | Cabo Verde | 0.0 /100 | #304 | Tragic 7.0% |
| Immigrants | Micronesia | 0.0 /100 | #305 | Tragic 7.0% |
| Iroquois | 0.0 /100 | #306 | Tragic 7.1% |
| Spanish Americans | 0.0 /100 | #307 | Tragic 7.1% |
| Chippewa | 0.0 /100 | #308 | Tragic 7.1% |
| Immigrants | Azores | 0.0 /100 | #309 | Tragic 7.1% |
| Arapaho | 0.0 /100 | #310 | Tragic 7.1% |
| Cree | 0.0 /100 | #311 | Tragic 7.1% |
| Delaware | 0.0 /100 | #312 | Tragic 7.1% |
| Immigrants | Yemen | 0.0 /100 | #313 | Tragic 7.1% |
| Blackfeet | 0.0 /100 | #314 | Tragic 7.1% |
| Shoshone | 0.0 /100 | #315 | Tragic 7.1% |
Demographics Similar to Japanese by Ambulatory Disability
In terms of ambulatory disability, the demographic groups most similar to Japanese are Mexican American Indian (6.3%, a difference of 0.0%), Samoan (6.3%, a difference of 0.010%), Immigrants from Mexico (6.3%, a difference of 0.12%), Immigrants from Latin America (6.3%, a difference of 0.13%), and Canadian (6.3%, a difference of 0.14%).
| Demographics | Rating | Rank | Ambulatory Disability |
| Finns | 17.2 /100 | #206 | Poor 6.2% |
| Alsatians | 15.1 /100 | #207 | Poor 6.3% |
| Bangladeshis | 14.2 /100 | #208 | Poor 6.3% |
| Immigrants | Iraq | 14.0 /100 | #209 | Poor 6.3% |
| Immigrants | Laos | 13.2 /100 | #210 | Poor 6.3% |
| Samoans | 12.1 /100 | #211 | Poor 6.3% |
| Mexican American Indians | 12.0 /100 | #212 | Poor 6.3% |
| Japanese | 12.0 /100 | #213 | Poor 6.3% |
| Immigrants | Mexico | 11.0 /100 | #214 | Poor 6.3% |
| Immigrants | Latin America | 11.0 /100 | #215 | Poor 6.3% |
| Canadians | 10.9 /100 | #216 | Poor 6.3% |
| Yugoslavians | 10.9 /100 | #217 | Poor 6.3% |
| Guamanians/Chamorros | 10.6 /100 | #218 | Poor 6.3% |
| Indonesians | 9.9 /100 | #219 | Tragic 6.3% |
| Immigrants | Albania | 9.6 /100 | #220 | Tragic 6.3% |