Chippewa vs Japanese Per Capita Income
COMPARE
Chippewa
Japanese
Per Capita Income
Per Capita Income Comparison
Chippewa
Japanese
$36,631
PER CAPITA INCOME
0.0/ 100
METRIC RATING
311th/ 347
METRIC RANK
$39,870
PER CAPITA INCOME
1.4/ 100
METRIC RATING
249th/ 347
METRIC RANK
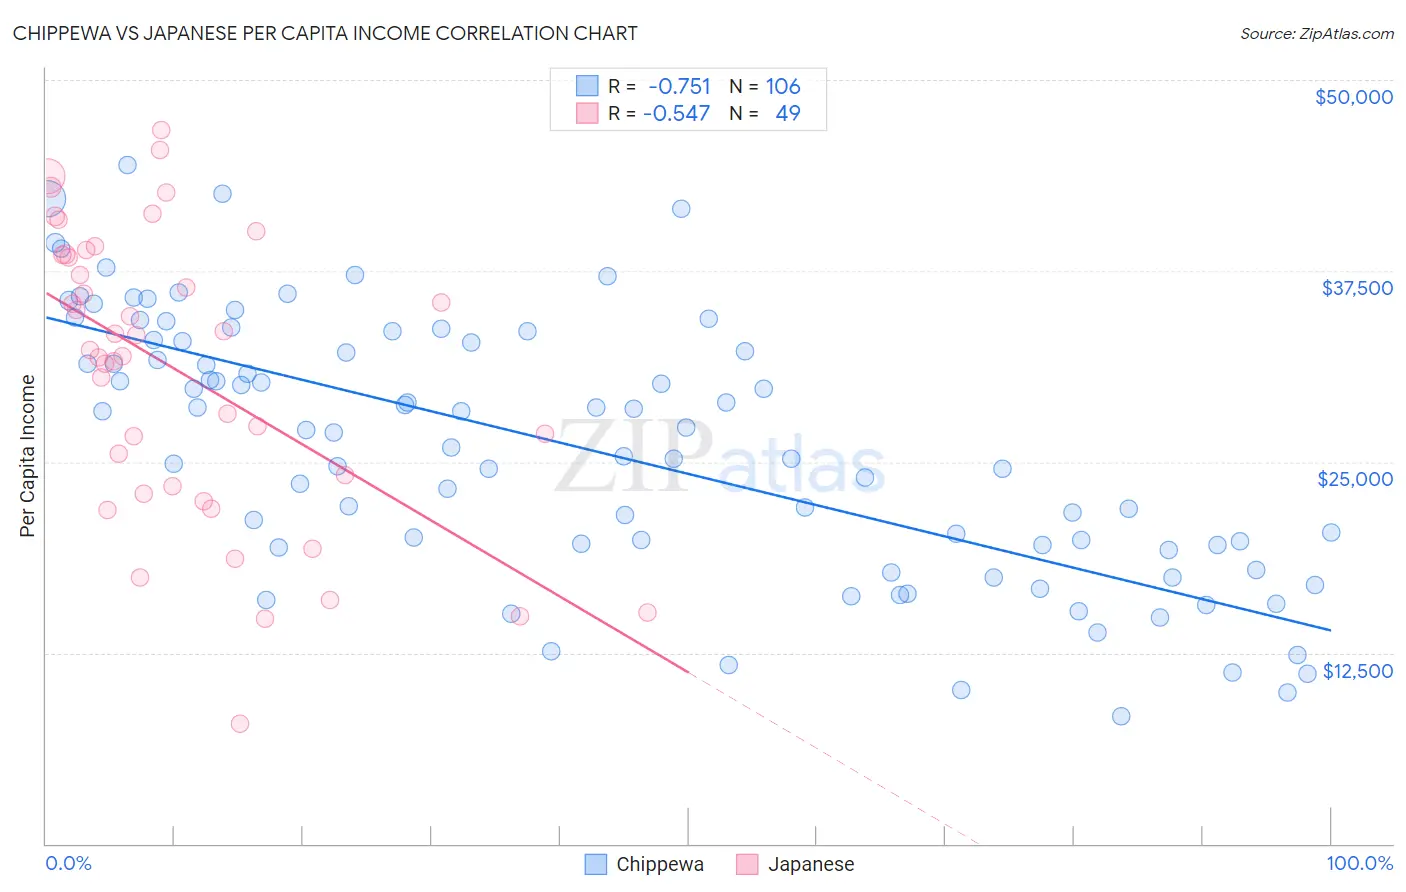
Chippewa vs Japanese Per Capita Income Correlation Chart
The statistical analysis conducted on geographies consisting of 215,067,961 people shows a strong negative correlation between the proportion of Chippewa and per capita income in the United States with a correlation coefficient (R) of -0.751 and weighted average of $36,631. Similarly, the statistical analysis conducted on geographies consisting of 249,192,968 people shows a substantial negative correlation between the proportion of Japanese and per capita income in the United States with a correlation coefficient (R) of -0.547 and weighted average of $39,870, a difference of 8.8%.
Per Capita Income Correlation Summary
| Measurement | Chippewa | Japanese |
| Minimum | $8,325 | $7,849 |
| Maximum | $44,407 | $46,714 |
| Range | $36,082 | $38,865 |
| Mean | $25,989 | $30,879 |
| Median | $27,024 | $32,329 |
| Interquartile 25% (IQ1) | $19,564 | $23,174 |
| Interquartile 75% (IQ3) | $32,911 | $38,578 |
| Interquartile Range (IQR) | $13,347 | $15,404 |
| Standard Deviation (Sample) | $8,516 | $9,433 |
| Standard Deviation (Population) | $8,476 | $9,336 |
Similar Demographics by Per Capita Income
Demographics Similar to Chippewa by Per Capita Income
In terms of per capita income, the demographic groups most similar to Chippewa are Ute ($36,651, a difference of 0.060%), Immigrants from Honduras ($36,665, a difference of 0.090%), Fijian ($36,690, a difference of 0.16%), Chickasaw ($36,475, a difference of 0.43%), and Immigrants from Latin America ($36,823, a difference of 0.53%).
| Demographics | Rating | Rank | Per Capita Income |
| Hondurans | 0.1 /100 | #304 | Tragic $37,031 |
| Inupiat | 0.1 /100 | #305 | Tragic $36,999 |
| Immigrants | Haiti | 0.0 /100 | #306 | Tragic $36,849 |
| Immigrants | Latin America | 0.0 /100 | #307 | Tragic $36,823 |
| Fijians | 0.0 /100 | #308 | Tragic $36,690 |
| Immigrants | Honduras | 0.0 /100 | #309 | Tragic $36,665 |
| Ute | 0.0 /100 | #310 | Tragic $36,651 |
| Chippewa | 0.0 /100 | #311 | Tragic $36,631 |
| Chickasaw | 0.0 /100 | #312 | Tragic $36,475 |
| Bahamians | 0.0 /100 | #313 | Tragic $36,427 |
| Seminole | 0.0 /100 | #314 | Tragic $36,180 |
| Yaqui | 0.0 /100 | #315 | Tragic $36,112 |
| Choctaw | 0.0 /100 | #316 | Tragic $35,999 |
| Dutch West Indians | 0.0 /100 | #317 | Tragic $35,922 |
| Bangladeshis | 0.0 /100 | #318 | Tragic $35,897 |
Demographics Similar to Japanese by Per Capita Income
In terms of per capita income, the demographic groups most similar to Japanese are Immigrants from Burma/Myanmar ($39,827, a difference of 0.11%), Samoan ($39,826, a difference of 0.11%), Cape Verdean ($39,935, a difference of 0.16%), Immigrants from Somalia ($39,974, a difference of 0.26%), and Cree ($40,056, a difference of 0.46%).
| Demographics | Rating | Rank | Per Capita Income |
| Immigrants | Western Africa | 2.2 /100 | #242 | Tragic $40,294 |
| German Russians | 2.2 /100 | #243 | Tragic $40,266 |
| French American Indians | 2.1 /100 | #244 | Tragic $40,244 |
| Sub-Saharan Africans | 1.9 /100 | #245 | Tragic $40,152 |
| Cree | 1.7 /100 | #246 | Tragic $40,056 |
| Immigrants | Somalia | 1.6 /100 | #247 | Tragic $39,974 |
| Cape Verdeans | 1.5 /100 | #248 | Tragic $39,935 |
| Japanese | 1.4 /100 | #249 | Tragic $39,870 |
| Immigrants | Burma/Myanmar | 1.3 /100 | #250 | Tragic $39,827 |
| Samoans | 1.3 /100 | #251 | Tragic $39,826 |
| Immigrants | Azores | 1.0 /100 | #252 | Tragic $39,608 |
| Osage | 1.0 /100 | #253 | Tragic $39,568 |
| Alaska Natives | 1.0 /100 | #254 | Tragic $39,558 |
| Immigrants | Middle Africa | 1.0 /100 | #255 | Tragic $39,529 |
| Hawaiians | 0.8 /100 | #256 | Tragic $39,403 |