Chippewa vs Immigrants from Zaire Ambulatory Disability
COMPARE
Chippewa
Immigrants from Zaire
Ambulatory Disability
Ambulatory Disability Comparison
Chippewa
Immigrants from Zaire
7.1%
AMBULATORY DISABILITY
0.0/ 100
METRIC RATING
308th/ 347
METRIC RANK
6.0%
AMBULATORY DISABILITY
83.6/ 100
METRIC RATING
139th/ 347
METRIC RANK
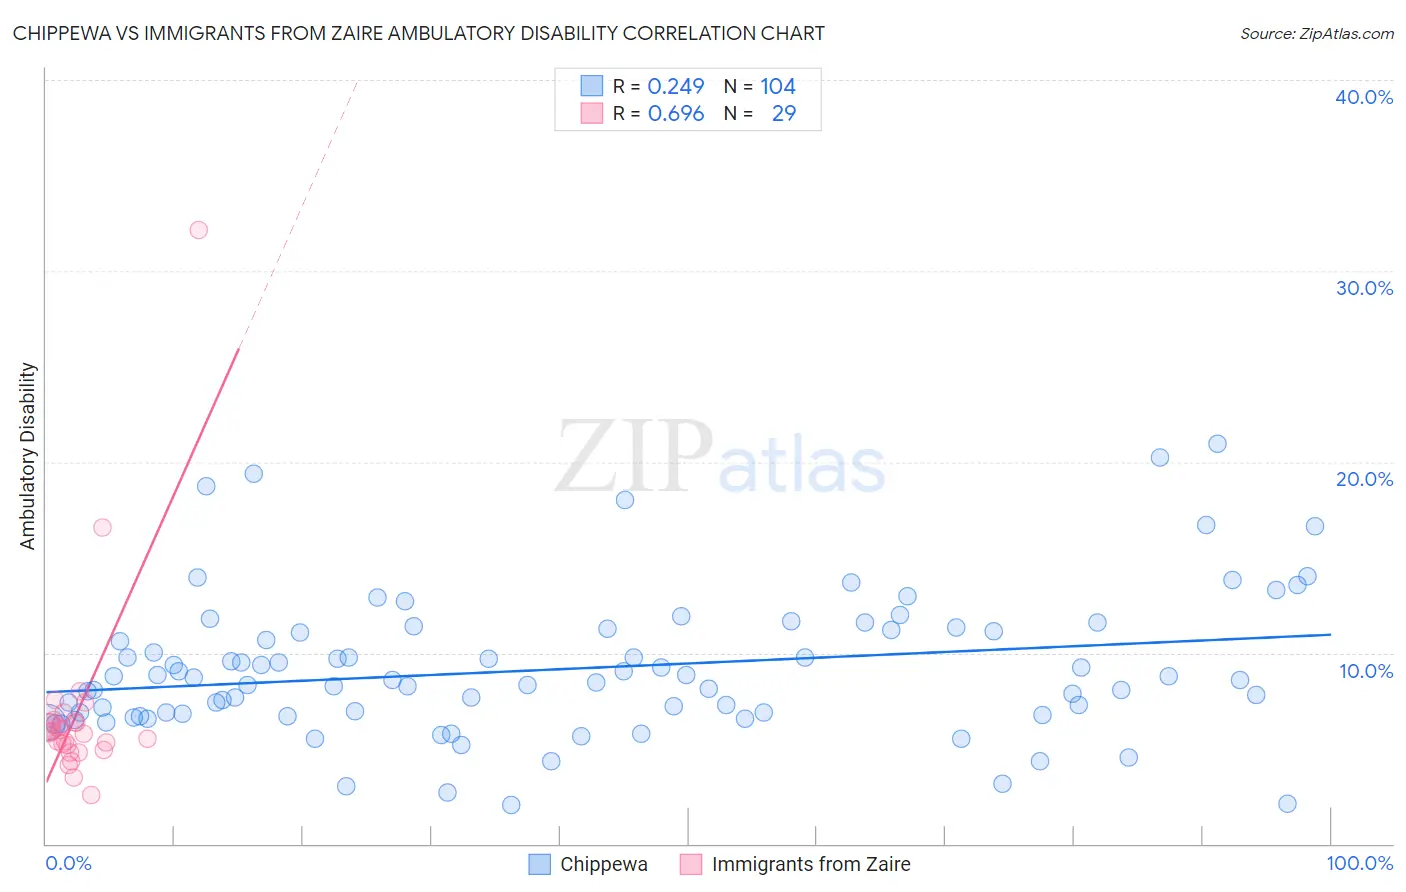
Chippewa vs Immigrants from Zaire Ambulatory Disability Correlation Chart
The statistical analysis conducted on geographies consisting of 215,009,829 people shows a weak positive correlation between the proportion of Chippewa and percentage of population with ambulatory disability in the United States with a correlation coefficient (R) of 0.249 and weighted average of 7.1%. Similarly, the statistical analysis conducted on geographies consisting of 107,247,600 people shows a significant positive correlation between the proportion of Immigrants from Zaire and percentage of population with ambulatory disability in the United States with a correlation coefficient (R) of 0.696 and weighted average of 6.0%, a difference of 18.1%.
Ambulatory Disability Correlation Summary
| Measurement | Chippewa | Immigrants from Zaire |
| Minimum | 2.0% | 2.5% |
| Maximum | 20.9% | 32.2% |
| Range | 18.9% | 29.6% |
| Mean | 9.1% | 6.9% |
| Median | 8.6% | 5.8% |
| Interquartile 25% (IQ1) | 6.8% | 5.0% |
| Interquartile 75% (IQ3) | 11.2% | 6.4% |
| Interquartile Range (IQR) | 4.4% | 1.4% |
| Standard Deviation (Sample) | 3.7% | 5.4% |
| Standard Deviation (Population) | 3.7% | 5.3% |
Similar Demographics by Ambulatory Disability
Demographics Similar to Chippewa by Ambulatory Disability
In terms of ambulatory disability, the demographic groups most similar to Chippewa are Spanish American (7.1%, a difference of 0.0%), Immigrants from the Azores (7.1%, a difference of 0.17%), Iroquois (7.1%, a difference of 0.27%), Arapaho (7.1%, a difference of 0.45%), and Cree (7.1%, a difference of 0.46%).
| Demographics | Rating | Rank | Ambulatory Disability |
| British West Indians | 0.0 /100 | #301 | Tragic 7.0% |
| Immigrants | Armenia | 0.0 /100 | #302 | Tragic 7.0% |
| Africans | 0.0 /100 | #303 | Tragic 7.0% |
| Immigrants | Cabo Verde | 0.0 /100 | #304 | Tragic 7.0% |
| Immigrants | Micronesia | 0.0 /100 | #305 | Tragic 7.0% |
| Iroquois | 0.0 /100 | #306 | Tragic 7.1% |
| Spanish Americans | 0.0 /100 | #307 | Tragic 7.1% |
| Chippewa | 0.0 /100 | #308 | Tragic 7.1% |
| Immigrants | Azores | 0.0 /100 | #309 | Tragic 7.1% |
| Arapaho | 0.0 /100 | #310 | Tragic 7.1% |
| Cree | 0.0 /100 | #311 | Tragic 7.1% |
| Delaware | 0.0 /100 | #312 | Tragic 7.1% |
| Immigrants | Yemen | 0.0 /100 | #313 | Tragic 7.1% |
| Blackfeet | 0.0 /100 | #314 | Tragic 7.1% |
| Shoshone | 0.0 /100 | #315 | Tragic 7.1% |
Demographics Similar to Immigrants from Zaire by Ambulatory Disability
In terms of ambulatory disability, the demographic groups most similar to Immigrants from Zaire are Immigrants from Hungary (6.0%, a difference of 0.030%), Czech (6.0%, a difference of 0.030%), Immigrants from North Macedonia (6.0%, a difference of 0.050%), Immigrants from Syria (6.0%, a difference of 0.050%), and Swedish (6.0%, a difference of 0.050%).
| Demographics | Rating | Rank | Ambulatory Disability |
| Immigrants | Europe | 87.8 /100 | #132 | Excellent 6.0% |
| Immigrants | Immigrants | 86.9 /100 | #133 | Excellent 6.0% |
| Ute | 86.6 /100 | #134 | Excellent 6.0% |
| Immigrants | Italy | 85.0 /100 | #135 | Excellent 6.0% |
| Immigrants | North Macedonia | 84.1 /100 | #136 | Excellent 6.0% |
| Immigrants | Syria | 84.1 /100 | #137 | Excellent 6.0% |
| Immigrants | Hungary | 83.9 /100 | #138 | Excellent 6.0% |
| Immigrants | Zaire | 83.6 /100 | #139 | Excellent 6.0% |
| Czechs | 83.3 /100 | #140 | Excellent 6.0% |
| Swedes | 83.1 /100 | #141 | Excellent 6.0% |
| Immigrants | Philippines | 83.0 /100 | #142 | Excellent 6.0% |
| Romanians | 82.9 /100 | #143 | Excellent 6.0% |
| Macedonians | 82.8 /100 | #144 | Excellent 6.0% |
| Pakistanis | 82.5 /100 | #145 | Excellent 6.0% |
| Immigrants | Greece | 82.5 /100 | #146 | Excellent 6.0% |