Chippewa vs Crow Self-Care Disability
COMPARE
Chippewa
Crow
Self-Care Disability
Self-Care Disability Comparison
Chippewa
Crow
2.6%
SELF-CARE DISABILITY
0.2/ 100
METRIC RATING
260th/ 347
METRIC RANK
2.5%
SELF-CARE DISABILITY
15.2/ 100
METRIC RATING
197th/ 347
METRIC RANK
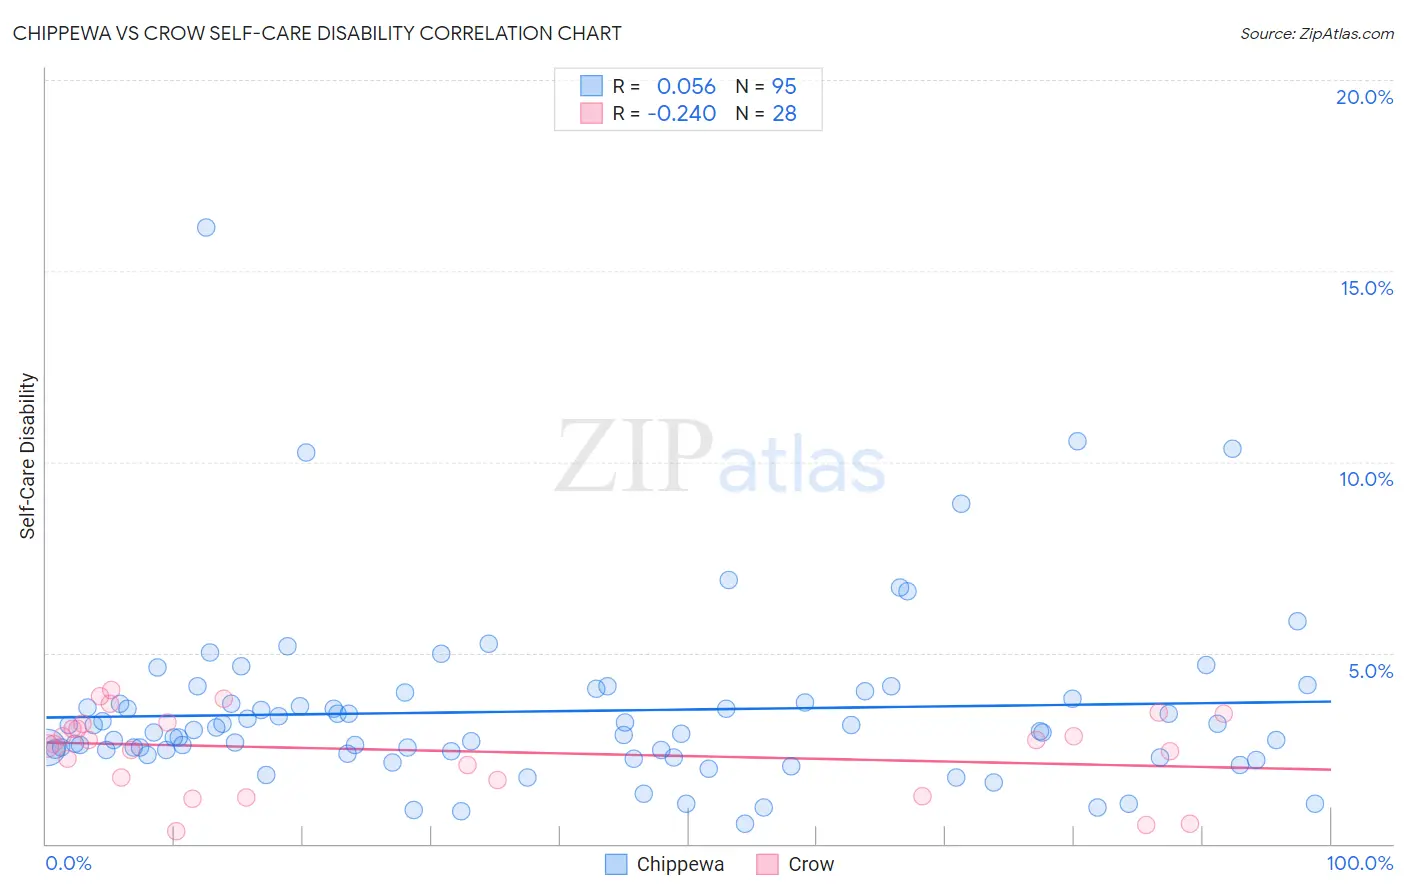
Chippewa vs Crow Self-Care Disability Correlation Chart
The statistical analysis conducted on geographies consisting of 214,880,520 people shows a slight positive correlation between the proportion of Chippewa and percentage of population with self-care disability in the United States with a correlation coefficient (R) of 0.056 and weighted average of 2.6%. Similarly, the statistical analysis conducted on geographies consisting of 59,179,234 people shows a weak negative correlation between the proportion of Crow and percentage of population with self-care disability in the United States with a correlation coefficient (R) of -0.240 and weighted average of 2.5%, a difference of 5.1%.
Self-Care Disability Correlation Summary
| Measurement | Chippewa | Crow |
| Minimum | 0.52% | 0.32% |
| Maximum | 16.1% | 4.0% |
| Range | 15.6% | 3.7% |
| Mean | 3.5% | 2.4% |
| Median | 2.9% | 2.7% |
| Interquartile 25% (IQ1) | 2.4% | 1.7% |
| Interquartile 75% (IQ3) | 3.8% | 3.2% |
| Interquartile Range (IQR) | 1.4% | 1.5% |
| Standard Deviation (Sample) | 2.3% | 1.1% |
| Standard Deviation (Population) | 2.3% | 1.0% |
Similar Demographics by Self-Care Disability
Demographics Similar to Chippewa by Self-Care Disability
In terms of self-care disability, the demographic groups most similar to Chippewa are Arapaho (2.6%, a difference of 0.020%), Immigrants from Belarus (2.6%, a difference of 0.040%), Nonimmigrants (2.6%, a difference of 0.11%), Shoshone (2.7%, a difference of 0.16%), and Potawatomi (2.6%, a difference of 0.18%).
| Demographics | Rating | Rank | Self-Care Disability |
| Immigrants | Haiti | 0.3 /100 | #253 | Tragic 2.6% |
| Haitians | 0.3 /100 | #254 | Tragic 2.6% |
| Tsimshian | 0.3 /100 | #255 | Tragic 2.6% |
| Immigrants | Central America | 0.3 /100 | #256 | Tragic 2.6% |
| Potawatomi | 0.3 /100 | #257 | Tragic 2.6% |
| Immigrants | Nonimmigrants | 0.3 /100 | #258 | Tragic 2.6% |
| Immigrants | Belarus | 0.2 /100 | #259 | Tragic 2.6% |
| Chippewa | 0.2 /100 | #260 | Tragic 2.6% |
| Arapaho | 0.2 /100 | #261 | Tragic 2.6% |
| Shoshone | 0.2 /100 | #262 | Tragic 2.7% |
| Immigrants | Latin America | 0.2 /100 | #263 | Tragic 2.7% |
| Immigrants | Iran | 0.2 /100 | #264 | Tragic 2.7% |
| Immigrants | Nicaragua | 0.2 /100 | #265 | Tragic 2.7% |
| Immigrants | Cambodia | 0.1 /100 | #266 | Tragic 2.7% |
| Yaqui | 0.1 /100 | #267 | Tragic 2.7% |
Demographics Similar to Crow by Self-Care Disability
In terms of self-care disability, the demographic groups most similar to Crow are Immigrants (2.5%, a difference of 0.020%), Immigrants from Southern Europe (2.5%, a difference of 0.030%), Korean (2.5%, a difference of 0.030%), Immigrants from Ghana (2.5%, a difference of 0.050%), and Immigrants from Western Africa (2.5%, a difference of 0.19%).
| Demographics | Rating | Rank | Self-Care Disability |
| Sioux | 24.6 /100 | #190 | Fair 2.5% |
| Moroccans | 22.9 /100 | #191 | Fair 2.5% |
| Soviet Union | 22.2 /100 | #192 | Fair 2.5% |
| Ukrainians | 21.4 /100 | #193 | Fair 2.5% |
| Immigrants | Germany | 17.9 /100 | #194 | Poor 2.5% |
| Immigrants | Southern Europe | 15.6 /100 | #195 | Poor 2.5% |
| Koreans | 15.5 /100 | #196 | Poor 2.5% |
| Crow | 15.2 /100 | #197 | Poor 2.5% |
| Immigrants | Immigrants | 15.0 /100 | #198 | Poor 2.5% |
| Immigrants | Ghana | 14.7 /100 | #199 | Poor 2.5% |
| Immigrants | Western Africa | 13.3 /100 | #200 | Poor 2.5% |
| Immigrants | South Eastern Asia | 12.9 /100 | #201 | Poor 2.5% |
| Slovaks | 12.6 /100 | #202 | Poor 2.5% |
| Immigrants | Lebanon | 12.4 /100 | #203 | Poor 2.5% |
| Immigrants | Bahamas | 11.9 /100 | #204 | Poor 2.5% |