Macedonian vs Crow Self-Care Disability
COMPARE
Macedonian
Crow
Self-Care Disability
Self-Care Disability Comparison
Macedonians
Crow
2.4%
SELF-CARE DISABILITY
96.9/ 100
METRIC RATING
94th/ 347
METRIC RANK
2.5%
SELF-CARE DISABILITY
15.2/ 100
METRIC RATING
197th/ 347
METRIC RANK
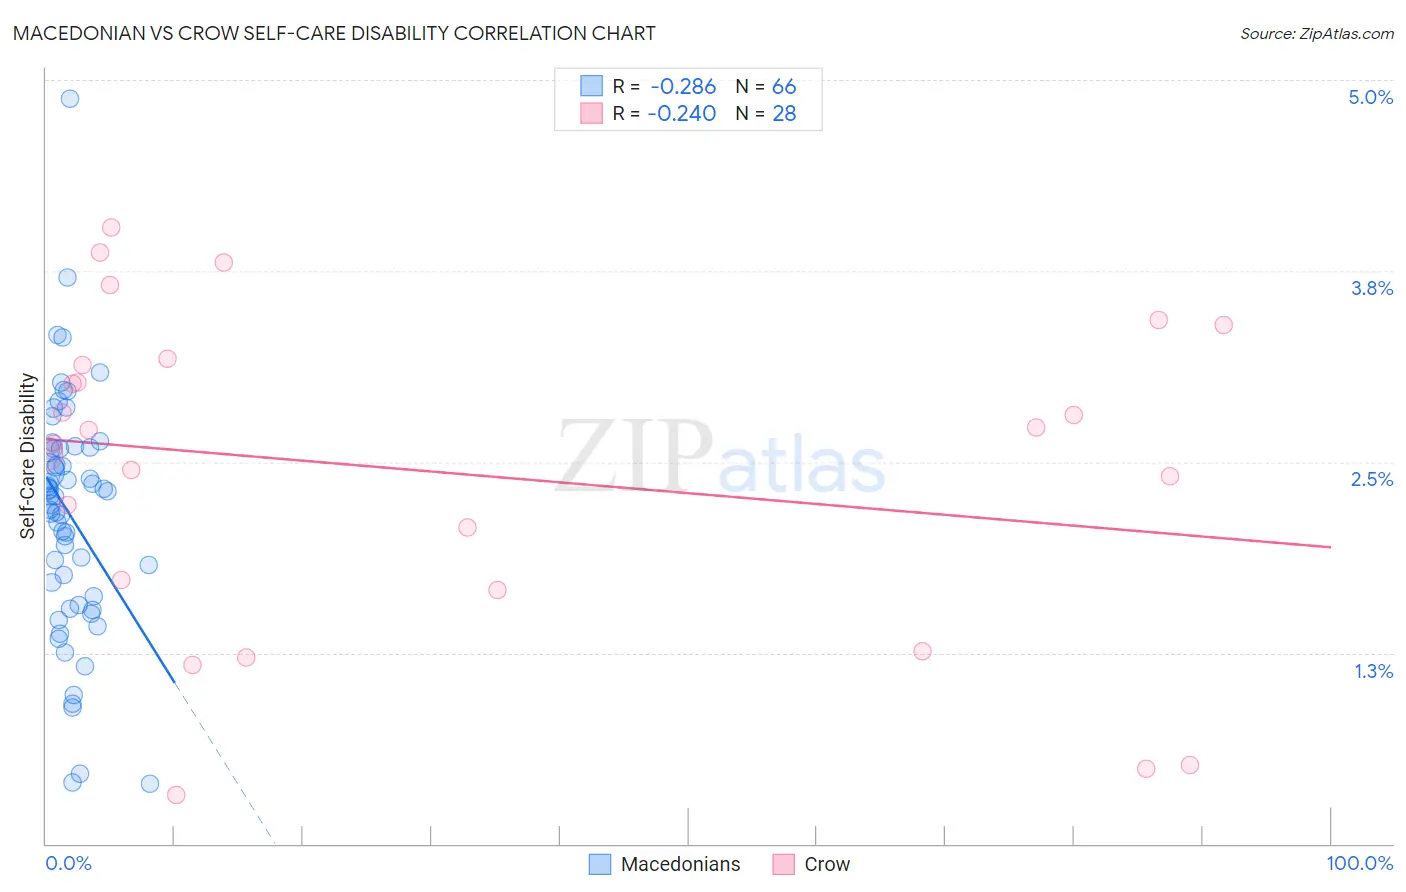
Macedonian vs Crow Self-Care Disability Correlation Chart
The statistical analysis conducted on geographies consisting of 132,583,440 people shows a weak negative correlation between the proportion of Macedonians and percentage of population with self-care disability in the United States with a correlation coefficient (R) of -0.286 and weighted average of 2.4%. Similarly, the statistical analysis conducted on geographies consisting of 59,179,234 people shows a weak negative correlation between the proportion of Crow and percentage of population with self-care disability in the United States with a correlation coefficient (R) of -0.240 and weighted average of 2.5%, a difference of 6.4%.
Self-Care Disability Correlation Summary
| Measurement | Macedonian | Crow |
| Minimum | 0.40% | 0.32% |
| Maximum | 4.9% | 4.0% |
| Range | 4.5% | 3.7% |
| Mean | 2.2% | 2.4% |
| Median | 2.3% | 2.7% |
| Interquartile 25% (IQ1) | 1.6% | 1.7% |
| Interquartile 75% (IQ3) | 2.6% | 3.2% |
| Interquartile Range (IQR) | 0.97% | 1.5% |
| Standard Deviation (Sample) | 0.78% | 1.1% |
| Standard Deviation (Population) | 0.78% | 1.0% |
Similar Demographics by Self-Care Disability
Demographics Similar to Macedonians by Self-Care Disability
In terms of self-care disability, the demographic groups most similar to Macedonians are Immigrants from Asia (2.4%, a difference of 0.010%), Immigrants from Latvia (2.4%, a difference of 0.040%), Immigrants from Chile (2.4%, a difference of 0.070%), Swiss (2.4%, a difference of 0.11%), and Immigrants from Poland (2.4%, a difference of 0.20%).
| Demographics | Rating | Rank | Self-Care Disability |
| Sierra Leoneans | 98.0 /100 | #87 | Exceptional 2.4% |
| Lithuanians | 98.0 /100 | #88 | Exceptional 2.4% |
| Immigrants | Congo | 98.0 /100 | #89 | Exceptional 2.4% |
| Immigrants | Czechoslovakia | 97.7 /100 | #90 | Exceptional 2.4% |
| Immigrants | Jordan | 97.7 /100 | #91 | Exceptional 2.4% |
| Icelanders | 97.4 /100 | #92 | Exceptional 2.4% |
| Immigrants | Latvia | 97.0 /100 | #93 | Exceptional 2.4% |
| Macedonians | 96.9 /100 | #94 | Exceptional 2.4% |
| Immigrants | Asia | 96.9 /100 | #95 | Exceptional 2.4% |
| Immigrants | Chile | 96.7 /100 | #96 | Exceptional 2.4% |
| Swiss | 96.6 /100 | #97 | Exceptional 2.4% |
| Immigrants | Poland | 96.4 /100 | #98 | Exceptional 2.4% |
| Immigrants | Israel | 96.1 /100 | #99 | Exceptional 2.4% |
| Europeans | 95.8 /100 | #100 | Exceptional 2.4% |
| Immigrants | Scotland | 95.7 /100 | #101 | Exceptional 2.4% |
Demographics Similar to Crow by Self-Care Disability
In terms of self-care disability, the demographic groups most similar to Crow are Immigrants (2.5%, a difference of 0.020%), Immigrants from Southern Europe (2.5%, a difference of 0.030%), Korean (2.5%, a difference of 0.030%), Immigrants from Ghana (2.5%, a difference of 0.050%), and Immigrants from Western Africa (2.5%, a difference of 0.19%).
| Demographics | Rating | Rank | Self-Care Disability |
| Sioux | 24.6 /100 | #190 | Fair 2.5% |
| Moroccans | 22.9 /100 | #191 | Fair 2.5% |
| Soviet Union | 22.2 /100 | #192 | Fair 2.5% |
| Ukrainians | 21.4 /100 | #193 | Fair 2.5% |
| Immigrants | Germany | 17.9 /100 | #194 | Poor 2.5% |
| Immigrants | Southern Europe | 15.6 /100 | #195 | Poor 2.5% |
| Koreans | 15.5 /100 | #196 | Poor 2.5% |
| Crow | 15.2 /100 | #197 | Poor 2.5% |
| Immigrants | Immigrants | 15.0 /100 | #198 | Poor 2.5% |
| Immigrants | Ghana | 14.7 /100 | #199 | Poor 2.5% |
| Immigrants | Western Africa | 13.3 /100 | #200 | Poor 2.5% |
| Immigrants | South Eastern Asia | 12.9 /100 | #201 | Poor 2.5% |
| Slovaks | 12.6 /100 | #202 | Poor 2.5% |
| Immigrants | Lebanon | 12.4 /100 | #203 | Poor 2.5% |
| Immigrants | Bahamas | 11.9 /100 | #204 | Poor 2.5% |