Basque vs Crow Self-Care Disability
COMPARE
Basque
Crow
Self-Care Disability
Self-Care Disability Comparison
Basques
Crow
2.4%
SELF-CARE DISABILITY
74.0/ 100
METRIC RATING
151st/ 347
METRIC RANK
2.5%
SELF-CARE DISABILITY
15.2/ 100
METRIC RATING
197th/ 347
METRIC RANK
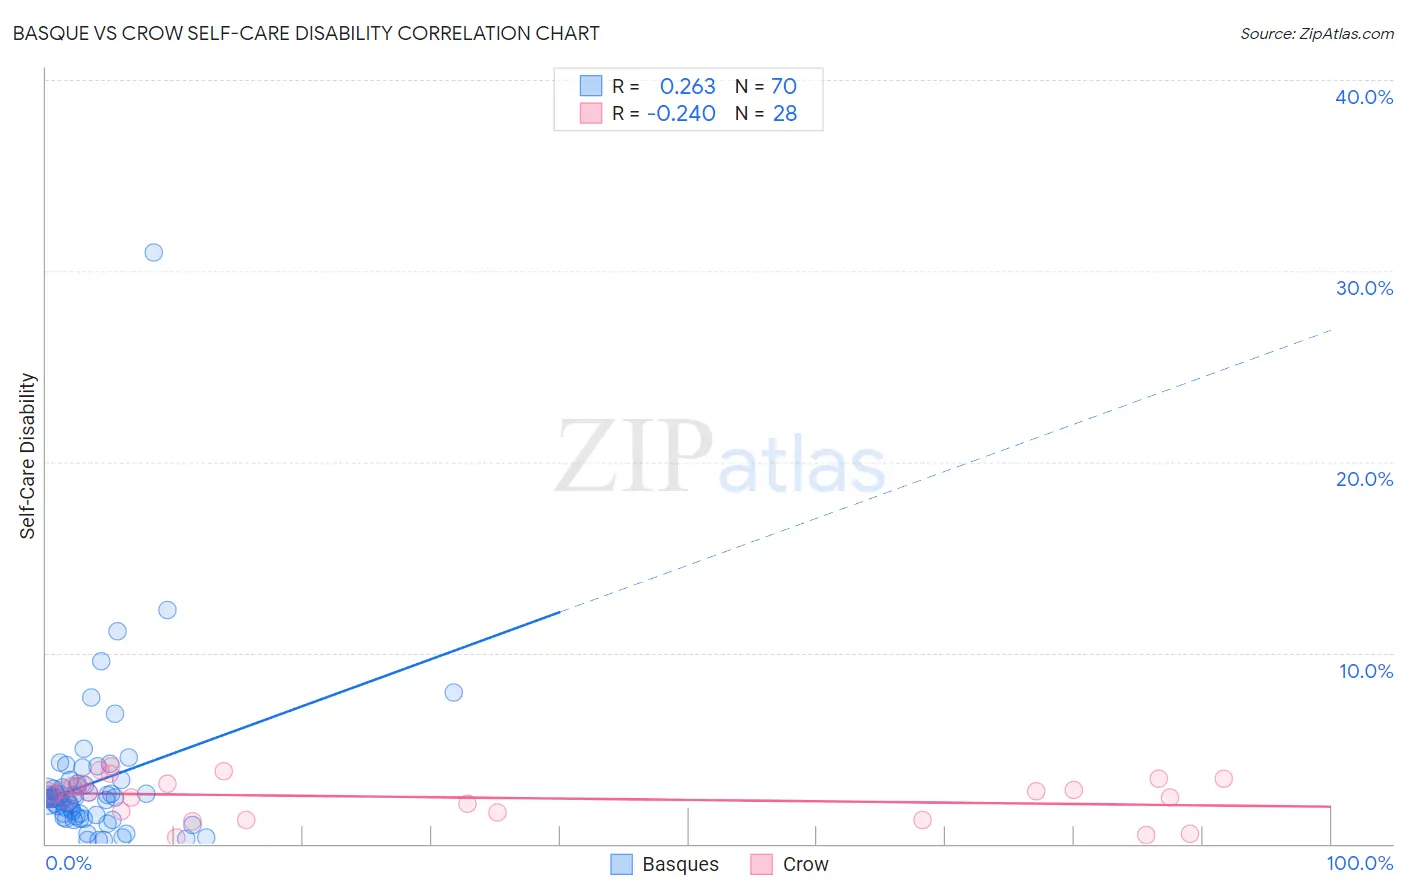
Basque vs Crow Self-Care Disability Correlation Chart
The statistical analysis conducted on geographies consisting of 165,703,684 people shows a weak positive correlation between the proportion of Basques and percentage of population with self-care disability in the United States with a correlation coefficient (R) of 0.263 and weighted average of 2.4%. Similarly, the statistical analysis conducted on geographies consisting of 59,179,234 people shows a weak negative correlation between the proportion of Crow and percentage of population with self-care disability in the United States with a correlation coefficient (R) of -0.240 and weighted average of 2.5%, a difference of 3.3%.
Self-Care Disability Correlation Summary
| Measurement | Basque | Crow |
| Minimum | 0.19% | 0.32% |
| Maximum | 31.0% | 4.0% |
| Range | 30.8% | 3.7% |
| Mean | 3.2% | 2.4% |
| Median | 2.4% | 2.7% |
| Interquartile 25% (IQ1) | 1.5% | 1.7% |
| Interquartile 75% (IQ3) | 3.1% | 3.2% |
| Interquartile Range (IQR) | 1.5% | 1.5% |
| Standard Deviation (Sample) | 4.1% | 1.1% |
| Standard Deviation (Population) | 4.1% | 1.0% |
Similar Demographics by Self-Care Disability
Demographics Similar to Basques by Self-Care Disability
In terms of self-care disability, the demographic groups most similar to Basques are Tlingit-Haida (2.4%, a difference of 0.030%), Immigrants from England (2.4%, a difference of 0.030%), Immigrants from Costa Rica (2.4%, a difference of 0.070%), Arab (2.4%, a difference of 0.11%), and Italian (2.4%, a difference of 0.11%).
| Demographics | Rating | Rank | Self-Care Disability |
| Costa Ricans | 80.8 /100 | #144 | Excellent 2.4% |
| Germans | 80.1 /100 | #145 | Excellent 2.4% |
| Israelis | 80.0 /100 | #146 | Good 2.4% |
| Dutch | 77.5 /100 | #147 | Good 2.4% |
| Romanians | 75.8 /100 | #148 | Good 2.4% |
| Arabs | 75.7 /100 | #149 | Good 2.4% |
| Immigrants | Costa Rica | 75.1 /100 | #150 | Good 2.4% |
| Basques | 74.0 /100 | #151 | Good 2.4% |
| Tlingit-Haida | 73.5 /100 | #152 | Good 2.4% |
| Immigrants | England | 73.5 /100 | #153 | Good 2.4% |
| Italians | 72.2 /100 | #154 | Good 2.4% |
| Pakistanis | 71.4 /100 | #155 | Good 2.4% |
| Nigerians | 70.6 /100 | #156 | Good 2.4% |
| Immigrants | Europe | 69.6 /100 | #157 | Good 2.4% |
| Immigrants | Western Europe | 68.6 /100 | #158 | Good 2.4% |
Demographics Similar to Crow by Self-Care Disability
In terms of self-care disability, the demographic groups most similar to Crow are Immigrants (2.5%, a difference of 0.020%), Immigrants from Southern Europe (2.5%, a difference of 0.030%), Korean (2.5%, a difference of 0.030%), Immigrants from Ghana (2.5%, a difference of 0.050%), and Immigrants from Western Africa (2.5%, a difference of 0.19%).
| Demographics | Rating | Rank | Self-Care Disability |
| Sioux | 24.6 /100 | #190 | Fair 2.5% |
| Moroccans | 22.9 /100 | #191 | Fair 2.5% |
| Soviet Union | 22.2 /100 | #192 | Fair 2.5% |
| Ukrainians | 21.4 /100 | #193 | Fair 2.5% |
| Immigrants | Germany | 17.9 /100 | #194 | Poor 2.5% |
| Immigrants | Southern Europe | 15.6 /100 | #195 | Poor 2.5% |
| Koreans | 15.5 /100 | #196 | Poor 2.5% |
| Crow | 15.2 /100 | #197 | Poor 2.5% |
| Immigrants | Immigrants | 15.0 /100 | #198 | Poor 2.5% |
| Immigrants | Ghana | 14.7 /100 | #199 | Poor 2.5% |
| Immigrants | Western Africa | 13.3 /100 | #200 | Poor 2.5% |
| Immigrants | South Eastern Asia | 12.9 /100 | #201 | Poor 2.5% |
| Slovaks | 12.6 /100 | #202 | Poor 2.5% |
| Immigrants | Lebanon | 12.4 /100 | #203 | Poor 2.5% |
| Immigrants | Bahamas | 11.9 /100 | #204 | Poor 2.5% |